
13.2.3: Interpreting Main Effects and Interactions in Graphs
- Page ID
- 17402

Designs with multiple factors are very common. When you read a research article (and you will!), you will often see tables and graphs that show the results from designs with multiple factors. It would be good for you if you were comfortable interpreting the meaning of those results. You should look at the main effects, but understand that any statistically significant interaction is the real result because the interaction tells you more about the levels of each IV than any main effect can.
2x2 designs
Let’s take the case of 2x2 designs. There will always be the possibility of two main effects and one interaction. You will always be able to compare the means for each main effect and interaction. If the two means from one variable are different, then there is a main effect. If the two means from the other variable are different, then there is a main effect. And then you look at the cell means (the means in the four combinations of the two IV's two levels), and those could have all sorts of relationships. There a bunch of ways all of this can turn out. Check out the ways, there are eight of them:
- no IV1 main effect, no IV2 main effect, no interaction (This is the null hypothesis!)
- IV1 main effect, no IV2 main effect, no interaction
- IV1 main effect, no IV2 main effect, yes interaction
- IV1 main effect, IV2 main effect, no interaction
- IV1 main effect, IV2 main effect, yes interaction
- no IV1 main effect, IV2 main effect, no interaction
- no IV1 main effect, IV2 main effect, yes interaction
- no IV1 main effect, no IV2 main effect, yes interaction
OK, so if you run a 2x2, any of these eight general patterns could occur in your data. That’s a lot to keep track of. As you develop your skills in examining graphs that plot means, you should be able to look at the graph and visually guesstimate if there is, or is not, a main effect or interaction. You will need you inferential statistics to tell you for sure, but it is worth knowing how to know see the patterns. Look at the eight patterns in Figure \(\PageIndex{1}\).
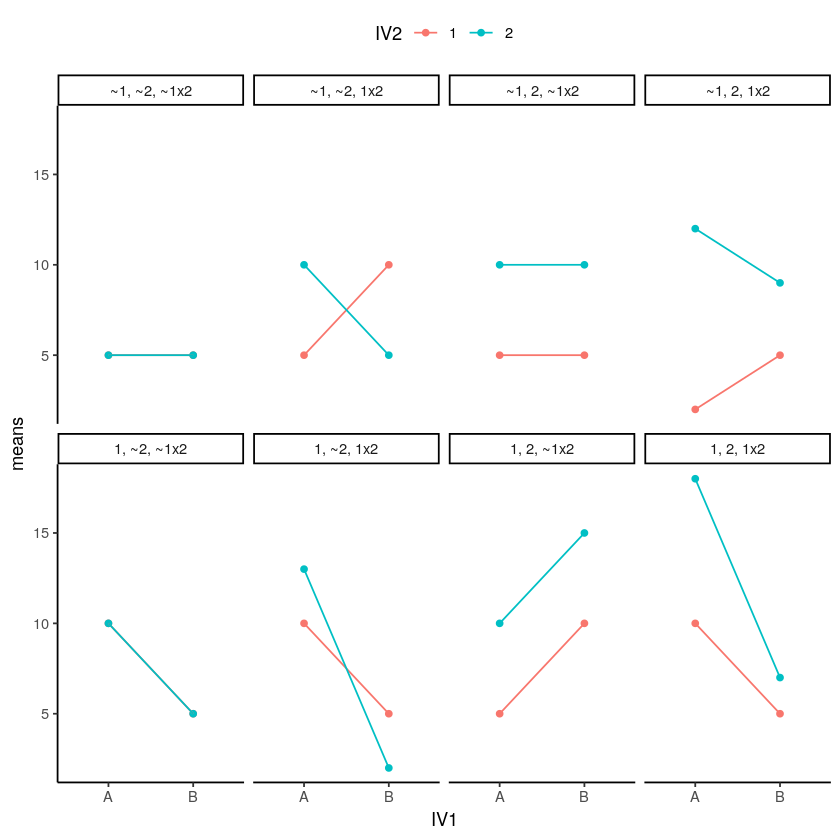
Whenever the lines cross, or would cross if they kept going, you have a possibility of an interaction. Whenever the lines are parallel, there can’t be an interaction. When both of the points on the A side are higher or lower than both of the points on the B side, then you have a main effect for IV1 (A vs B). Whenever the green line is above or below the red line, then you have a main effect for IV2 (1 vs. 2).
We know this is complicated. You should see what all the possibilities look like when we start adding more levels or more IVs! It gets nuts. Because of this nuttiness, it is often good practice to make your research designs simple (as few IVs and levels as possible to test your question). That way it will be easier to interpret your data. Whenever you see that someone ran a 4x3x7x2 design, your head should spin. It’s just too complicated.
Do you remember Stephen Chew’s video series on how to learn? Well, his second video (What Students Should Know about How People Learn) has a factorial design (with an extra control group).
Watching this video can help you understand factorial designs, including main effects and interactions), as well as learn about learning!
Contributors and Attributions
- Matthew J. C. Crump (Brooklyn College of CUNY)
- Dr. Stephen Chew's "What Students Should Know About How People Learn" (Part 2 of "How to Get the Most Out of Studying" series)