

12.5: Practice BG ANOVA on Job Applicants
- Page ID
- 44899

\( \newcommand{\vecs}[1]{\overset { \scriptstyle \rightharpoonup} {\mathbf{#1}} } \)
\( \newcommand{\vecd}[1]{\overset{-\!-\!\rightharpoonup}{\vphantom{a}\smash {#1}}} \)
\( \newcommand{\dsum}{\displaystyle\sum\limits} \)
\( \newcommand{\dint}{\displaystyle\int\limits} \)
\( \newcommand{\dlim}{\displaystyle\lim\limits} \)
\( \newcommand{\id}{\mathrm{id}}\) \( \newcommand{\Span}{\mathrm{span}}\)
( \newcommand{\kernel}{\mathrm{null}\,}\) \( \newcommand{\range}{\mathrm{range}\,}\)
\( \newcommand{\RealPart}{\mathrm{Re}}\) \( \newcommand{\ImaginaryPart}{\mathrm{Im}}\)
\( \newcommand{\Argument}{\mathrm{Arg}}\) \( \newcommand{\norm}[1]{\| #1 \|}\)
\( \newcommand{\inner}[2]{\langle #1, #2 \rangle}\)
\( \newcommand{\Span}{\mathrm{span}}\)
\( \newcommand{\id}{\mathrm{id}}\)
\( \newcommand{\Span}{\mathrm{span}}\)
\( \newcommand{\kernel}{\mathrm{null}\,}\)
\( \newcommand{\range}{\mathrm{range}\,}\)
\( \newcommand{\RealPart}{\mathrm{Re}}\)
\( \newcommand{\ImaginaryPart}{\mathrm{Im}}\)
\( \newcommand{\Argument}{\mathrm{Arg}}\)
\( \newcommand{\norm}[1]{\| #1 \|}\)
\( \newcommand{\inner}[2]{\langle #1, #2 \rangle}\)
\( \newcommand{\Span}{\mathrm{span}}\) \( \newcommand{\AA}{\unicode[.8,0]{x212B}}\)
\( \newcommand{\vectorA}[1]{\vec{#1}} % arrow\)
\( \newcommand{\vectorAt}[1]{\vec{\text{#1}}} % arrow\)
\( \newcommand{\vectorB}[1]{\overset { \scriptstyle \rightharpoonup} {\mathbf{#1}} } \)
\( \newcommand{\vectorC}[1]{\textbf{#1}} \)
\( \newcommand{\vectorD}[1]{\overrightarrow{#1}} \)
\( \newcommand{\vectorDt}[1]{\overrightarrow{\text{#1}}} \)
\( \newcommand{\vectE}[1]{\overset{-\!-\!\rightharpoonup}{\vphantom{a}\smash{\mathbf {#1}}}} \)
\( \newcommand{\vecs}[1]{\overset { \scriptstyle \rightharpoonup} {\mathbf{#1}} } \)
\(\newcommand{\longvect}{\overrightarrow}\)
\( \newcommand{\vecd}[1]{\overset{-\!-\!\rightharpoonup}{\vphantom{a}\smash {#1}}} \)
\(\newcommand{\ket}[1]{\left| #1 \right>}\)
\(\newcommand{\bra}[1]{\left< #1 \right|}\)
\(\newcommand{\braket}[2]{\left< #1 \vphantom{#2} \right| \left. #2 \vphantom{#1} \right>}\)
\(\newcommand{\braopket}[3]{\left< #1 \vphantom{#2}\vphantom{#3} \right| #2 \vphantom{#1}\vphantom{#3} \left| #3 \vphantom{#1}\vphantom{#2} \right>}\)
\(\newcommand{\qmvec}[1]{\mathbf{\vec{#1}}}\)
\(\newcommand{\op}[1]{\hat{\mathbf{#1}}}\)
\(\newcommand{\expect}[1]{\langle #1 \rangle}\)
\(\newcommand{\dfn}[1]{\emph{\textbf{#1}}}\)
Let's practice our five-step process using the ANOVA Summary Table to complete the calculations, but the Sum of Squares will be provided in this example.
Scenario
Our data come from three groups of 10 people each, all of whom applied for a single job opening: those with no college degree, those with a college degree that is not related to the job opening, and those with a college degree from a relevant field. We want to know if we can use this group membership to account for our observed variability in their scores on a test related to the job that they applied for, and, by doing so, see if there is a difference between our three group means.
Step 1: Hypotheses
Our hypotheses are concerned with the average score on the test for each of the groups based on education level, so you get to decide which groups you think will have a higher score, which groups will earn a lower average score, and which groups will have scores that are similar.
Determine the research hypothesis in words and symbols. You can fill in the following underlined spot with the symbols for greater than (>), less than (<), or equal signs. Just remember, at least one pair of means must be predicted to be different from each other.
Symbols:
- \( \overline{X}_{N} \) _____ \( \overline{X}_{R} \)
- \( \overline{X}_{N} \) _____ \(\overline{X}_{U} \)
- \( \overline{X}_{R} \) _____ \(\overline{X}_{U} \)
- Answer
-
Here's a reasonable research hypothesis. However, without the group means to guide us, your research hypothesis might be slightly different. Just remember, at least one pair of means must be predicted to be different from each other.
- Research Hypothesis: Those with No Degree will have a lower average test score than those with a Related Degree, but will have a similar average test score to those with an unrelated degree. The average test score for those with a Related Degree will also have a higher average test score compared to those with an Unrelated Degree.
- Symbols:
- \( \overline{X}_{N} < \overline{X}_{R} \)
- \( \overline{X}_{N} = \overline{X}_{U} \)
- \( \overline{X}_{R} > \overline{X}_{U} \)
What about the null hypothesis?
State the null hypothesis in words and symbols.
- Answer
-
- Null Hypothesis: The average test score will be similar for each group; the degree does not affect the hiring rate.
- Symbols: \( \overline{X}_{N} = \overline{X}_{U} = \overline{X}_{R} \)
Step 2: Collect Data
As we didn’t design the study and collect the data, our job is to identify who the data was collected from, who they might represent, and what the IV groups and DV were.
Answer the following questions to understand the variables and groups that we are working with.
- Who is the sample?
- Who do might be the population?
- What is the IV (groups being compared)?
- What is the DV (quantitative variable being measured)?
- Answer
-
- The sample is the 30 people with different degrees (or no degree)?
- The population might be any job applicant?
- The IV can be called "Degree," with the levels being:
- None,
- Related to job
- Unrelated to job
- The DV is the score on the test.
Step 3: Analyze Data
Now that we have our hypotheses, we can calculate our test statistic. To do this, we will fill in the ANOVA table. We will use the Sum of Squares values that we are provided in Table \(\PageIndex{1}\).
| Source | \(SS\) | \(df\) | \(MS\) | \(F\) |
|---|---|---|---|---|
| Between | 8246 | |||
| Within | 3020 | |||
| Total | 11266 |
These may seem like random numbers, but remember that they are based on the distances between the groups themselves and within each group. Figure \(\PageIndex{2}\) shows the plot of the data with the group means and total mean included. If we wanted to, we could use this information, combined with our earlier information that each group has 10 people, to calculate the Between Groups Sum of Squares by hand. However, doing so would take some time, and without the specific values of the data points, we would not be able to calculate our Within Groups Sum of Squares, so we are just trusting that these values are the correct ones.
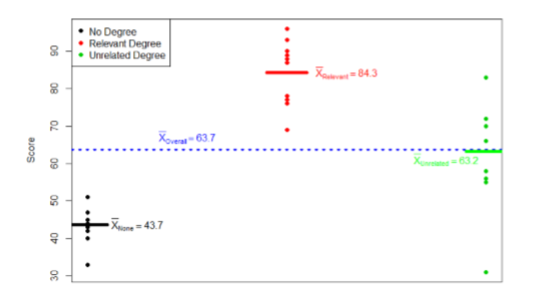
Using the information provided in the scenario and Table \(\PageIndex{1}\), fill in the rest of the ANOVA Summary Table in Table \(\PageIndex{2}\)
| Source | \(SS\) | \(df\) | \(MS\) | \(F\) |
|---|---|---|---|---|
| Between | 8246 | |||
| Within | 3020 | |||
| Total | 11266 |
Solution
Using the formulas that we learned about earlier, we can complete Table \(\PageIndex{3}\):
| Source | \(SS\) | \(df\) | \(MS\) | \(F\) |
|---|---|---|---|---|
| Between Groups | 8246 | \(k-1\) = 3 - 1 = 2 | \(\frac{S S_{B}}{d f_{B}} = \frac{8246}{2} = 4123.00\) | \(\frac{MS_{B}}{MS_{W}} = \frac{4123.00}{111.85} = 36.86\) |
| Within Groups (Error) | 3020 | \(N-k\) = 30 - 3 = 27 | \(\frac{S S_{W}}{d f_{W}} = \frac{3020}{27} = 111.85\) | N/A |
| Total | 11266 | \(N-1\) = 30 - 1 = 29 | N/A | N/A |
We leave those three cells that say N/A blank; no information is needed from them. So, that leaves us with the final table looking like Table \(\PageIndex{4}\) showing calculated F-score of 36.86.
| Source | \(SS\) | \(df\) | \(MS\) | \(F\) |
|---|---|---|---|---|
| Between Groups | 8246 | 2 | 4123.00 | 36.86 |
| Within Groups (Error) | 3020 | 27 | 111.85 | leave blank |
| Total | 11266 | 29 | leave blank | leave blank |
We can move on to comparing our calculated value to the critical value in step 4.
Step 4: Conclusion
Our first step to decide if any part of the research hypothesis might be true is to see if all of the means are similar to each other or not. To do this, we do what we’ve been doing: compare our calculated score (now an F-score, sometimes called an omnibus F) to a critical score. Because we are using a new test statistic, we will get a new critical value table: the \(F\) distribution table (shown in the Common Critical Value Tables in the Back Matter of this book).
For the critical values of F, there are three separate tables. Each table is for a different \(a\)-level. The first tables shows when the p-value is 1% (p=.01), the second table shows p-values of 5% (p=.05) and this is the one that we'll be using, and the third table is for when the p-value is 10% (p=.10).
Each of these tables has Degrees of Freedom on the top row (for the numerator) and on the left column (for the denominator). These correspond to the numerator and denominator of our test statistic, which, if you look at the ANOVA table presented earlier, are our Between Groups and Within Groups rows, respectively. The \(df_B\) is the Degrees of Freedom: for the Numerator because it is the degrees of freedom value used to calculate the Mean Square for the Between Groups source, which in turn was the numerator of our \(F\) statistic. Likewise, the \(df_W\) is the Degrees of Freedom for the Denominator because it is the degrees of freedom value used to calculate the Mean Square for the Within Groups (sometimes called Error) source, which was our denominator for \(F\).
The formulas for how to calculate all Degrees of Freedom are included in the relevant critical value page. Let’s go through this first set for ANOVA since we’re adding more to do. First, the formula for \(df_B\) is \(k – 1\); remember that k is the number of groups we are assessing. In this example, \(k = 3\) so our \(df_B\) = 2. This tells us that we will use the third column, the one labeled 2, to find our critical value. To find the proper row, we calculate the \(df_W\), which was \(N – k\). The original prompt told us that we have “three groups of 10 people each,” so our total sample size is 30. This makes our value for \(df_W\) = 27. If we follow the third column down to the row for \(df_W\) = 27, then find the middle row for \(p\) = 0.05, we see that our critical value is 3.35 on the second table (for p=.05).
We use this critical value the same way as we did before: it is our criterion against which we will compare our calculated test statistic to determine statistical significance. Our calculated test statistic was found to be \(F_{calc} = 36.86\) and our critical value was found to be \(F_{crit} = 3.35\). Our calculated statistic is larger than our critical value, so we can reject the null hypothesis.
(Critical \(<\) Calculated) \(=\) Reject null \(=\) At least one mean is different from at least one other mean. \(= p<.05\)
(Critical \(>\) Calculated) \(=\) Retain null \(=\) All of the means are similar. \(= p>.05\)
Based on our three groups of 10 people, we can conclude that average job test scores are statistically significantly different based on education level. The statistical sentence for this ANOVA will be: \(F(2,27)=36.86,p<.05\). Notice that when we report \(F\), we include both degrees of freedom. We always report the numerator then the denominator, separated by a comma.
Because we were only testing to see if any means were different from any other means, we cannot yet conclude which groups are different from the others or if our research hypothesis was supported, partially supported, or not supported. We will learn about pairwise comparisons next, which will help us decide which parts of our research hypothesis were supported.
Step 5: Write-Up is Interrupted!
Because we can’t yet know which parts, if any, of our research hypothesis was supported, we cannot complete our Null Hypothesis Significance Testing process quite yet! What we know now, based on rejecting the null hypothesis, is that at least one pair of means are statistically significantly different. We do not know which means are statistically different from which other means yet.