

1.4.2: Types of Variables
- Page ID
- 44787

\( \newcommand{\vecs}[1]{\overset { \scriptstyle \rightharpoonup} {\mathbf{#1}} } \)
\( \newcommand{\vecd}[1]{\overset{-\!-\!\rightharpoonup}{\vphantom{a}\smash {#1}}} \)
\( \newcommand{\dsum}{\displaystyle\sum\limits} \)
\( \newcommand{\dint}{\displaystyle\int\limits} \)
\( \newcommand{\dlim}{\displaystyle\lim\limits} \)
\( \newcommand{\id}{\mathrm{id}}\) \( \newcommand{\Span}{\mathrm{span}}\)
( \newcommand{\kernel}{\mathrm{null}\,}\) \( \newcommand{\range}{\mathrm{range}\,}\)
\( \newcommand{\RealPart}{\mathrm{Re}}\) \( \newcommand{\ImaginaryPart}{\mathrm{Im}}\)
\( \newcommand{\Argument}{\mathrm{Arg}}\) \( \newcommand{\norm}[1]{\| #1 \|}\)
\( \newcommand{\inner}[2]{\langle #1, #2 \rangle}\)
\( \newcommand{\Span}{\mathrm{span}}\)
\( \newcommand{\id}{\mathrm{id}}\)
\( \newcommand{\Span}{\mathrm{span}}\)
\( \newcommand{\kernel}{\mathrm{null}\,}\)
\( \newcommand{\range}{\mathrm{range}\,}\)
\( \newcommand{\RealPart}{\mathrm{Re}}\)
\( \newcommand{\ImaginaryPart}{\mathrm{Im}}\)
\( \newcommand{\Argument}{\mathrm{Arg}}\)
\( \newcommand{\norm}[1]{\| #1 \|}\)
\( \newcommand{\inner}[2]{\langle #1, #2 \rangle}\)
\( \newcommand{\Span}{\mathrm{span}}\) \( \newcommand{\AA}{\unicode[.8,0]{x212B}}\)
\( \newcommand{\vectorA}[1]{\vec{#1}} % arrow\)
\( \newcommand{\vectorAt}[1]{\vec{\text{#1}}} % arrow\)
\( \newcommand{\vectorB}[1]{\overset { \scriptstyle \rightharpoonup} {\mathbf{#1}} } \)
\( \newcommand{\vectorC}[1]{\textbf{#1}} \)
\( \newcommand{\vectorD}[1]{\overrightarrow{#1}} \)
\( \newcommand{\vectorDt}[1]{\overrightarrow{\text{#1}}} \)
\( \newcommand{\vectE}[1]{\overset{-\!-\!\rightharpoonup}{\vphantom{a}\smash{\mathbf {#1}}}} \)
\( \newcommand{\vecs}[1]{\overset { \scriptstyle \rightharpoonup} {\mathbf{#1}} } \)
\(\newcommand{\longvect}{\overrightarrow}\)
\( \newcommand{\vecd}[1]{\overset{-\!-\!\rightharpoonup}{\vphantom{a}\smash {#1}}} \)
\(\newcommand{\ket}[1]{\left| #1 \right>}\)
\(\newcommand{\bra}[1]{\left< #1 \right|}\)
\(\newcommand{\braket}[2]{\left< #1 \vphantom{#2} \right| \left. #2 \vphantom{#1} \right>}\)
\(\newcommand{\braopket}[3]{\left< #1 \vphantom{#2}\vphantom{#3} \right| #2 \vphantom{#1}\vphantom{#3} \left| #3 \vphantom{#1}\vphantom{#2} \right>}\)
\(\newcommand{\qmvec}[1]{\mathbf{\vec{#1}}}\)
\(\newcommand{\op}[1]{\hat{\mathbf{#1}}}\)
\(\newcommand{\expect}[1]{\langle #1 \rangle}\)
\(\newcommand{\dfn}[1]{\emph{\textbf{#1}}}\)
Some researchers call the first two scales of measurement (Ratio Scale and Interval Scale) “quantitative” because they measure things numerically, and call the last scale of measurement (Nominal Scale) “qualitative” because you count the number of things that have that quality.
The MooMooMath YouTube series did a short segment on these two types of variables.
It turns out that there are a LOT of videos online about statistics! Use them any time you are confused! My only caution is that some videos use slightly different formulas than in this textbook, and some use software that will not be discussed here, so make sure that the information in the video matches what your professor is showing you.
Ordinal scales are sort of in-between these two types. In terms of types of variables, ordinal scales should probably be considered qualitative variables because they aren't quite the ratio scale or the interval scale. However, in real life in statistical analyses, ordinal variables are often treated as quantitative variables.
Quantitative Variables
Quantitative variables are measured with some sort of scale that uses numbers. For example, height can be measures in the number of inches for everyone. Halfway between 1 inch and two inches has a meaning. Anything that you can measure with a number and finding a mean makes sense is a quantitative variable. If a decimal makes sense, then the variable is quantitative.
Type of variable that is measured with some sort of scale that uses numbers that measure something.
Quantitative variables are usually continuous.
Look up “quantitative variable” online. What is that definition? How is it similar or different from the one provided? Which makes more sense to you?
Let's look at an example.
The data are the weights of backpacks with books in them. You sample the same five students. The weights (in pounds) of their backpacks are 6.2, 7, 6.8, 9.1, 4.3. Notice that backpacks carrying three books can have different weights. Is the weight of the backpacks a quantitative variable?
Solution
Yes, the weights are quantitative data because weight is a numerical variable that is measured.
Qualitative Variables
Qualitative variables, which are the nominal Scale of Measurement, have different values to represent different categories or kinds. Qualitative/nominal variables name or label different categories of objects.
Type of variable that has different values to represent different categories or kinds This is the same as the nominal scale of measurement.
If your variable name, it's probably qualitative (especially if it was counted rather than measured).
Look up “qualitative variable” online. What is that definition? How is it similar or different from the one provided? Which makes more sense to you?
Something is either an apple or an orange, halfway between an apple and an orange doesn’t mean anything. Qualitative variables are counted, and the counts are used in statistical analyses. The name or label of a qualitative variable can be a number, but the number doesn’t mean anything. The Exercise below is an example of this.
Let’s say I collected data and coded it:
- Women = 1
- Men = 2,
- Non-binary = 3
Does it make any sense to add these numbers? To find the “mean” of gender?
- Answer
-
No. An average gender of 1.75 (or whatever) doesn't tell us much since gender is a qualitative variable (nominal scale of measurement), so you can only count it.
Qualitative variables are discrete.
Deciding: Quant or Qual?
Use the following to practice identifying whether variables are quantitative (measured with numbers) or qualitative (categories).
- City
- Gender
- Weight
- Type of degree
- College major
- Percent correct on Exam 1.
- Score on a depression scale (between 0 and 10)
- How long it takes you to blink after a puff of air hits your eye.
- What is another example of a quantitative variable?
- What is another example of a qualitative variable?
- Answer
-
- City: Qualitative (named, not measured)
- Gender: Qualitative (named, not measured)
- Weight: Quantitative (number measured in ounces, pounds, tons, etc.; decimal points make sense)
- Type of degree: Qualitative (named, not measured)
- College major: Qualitative (named, not measured)
- Percent correct on Exam 1: Quantitative (number measured in percentage points; decimal points make sense)
- Score on a depression scale (between 0 and 10): Quantitative (number measured by the scale; decimal points make sense)
- How long it takes you to blink after a puff of air hits your eye: Quantitative (number measured in milliseconds; decimal points make sense)
- What is another example of a quantitative variable? (Your answer should be something that was measured, not counted, and in which decimal points make sense.)
- What is another example of a qualitative variable? (Your answer should be something that is a category or name.)
Okay, that probably makes it seem like it's easy to know whether your variable is qualitative or quantitative.
Exercise \(\PageIndex{3}\) shows that variables can be defined in different ways.
You go to the supermarket and purchase three cans of soup (19 ounces) tomato bisque, 14.1 ounces lentil, and 19 ounces Italian wedding), two packages of nuts (walnuts and peanuts), four different kinds of vegetable (broccoli, cauliflower, spinach, and carrots), and two desserts (16 ounces Cherry Garcia ice cream and two pounds (32 ounces chocolate chip cookies).
Name data sets that are quantitative discrete, quantitative continuous, and qualitative.
Solution
One Possible Solution:
- The three cans of soup, two packages of nuts, four kinds of vegetables and two desserts are quantitative discrete data because you count them.
- The weights of the soups (19 ounces, 14.1 ounces, 19 ounces) are quantitative continuous data because you measure weights as precisely as possible.
- Types of soups, nuts, vegetables and desserts are qualitative data because they are categorical.
Try to identify additional data sets in this example.
As you'll learn in the next chapter, there are types of graphs that are designed for qualitative variables and other graphs that are most appropriate for quantitative variables. Before you learn about that, why don't you check out these graphs to see if you can figure out whether the variable is qualitative or quantitative.
When combining the academic majors that students graduated from into categories, it is clear that the social sciences and helping professions are very popular. What type of data does the pie chart in Figure \(\PageIndex{1}\) show?

- Answer
-
This pie chart shows the frequency (in percentages) of categories of majors from graduates in 2019-2020. Categories of the major is a qualitative data.
The Registrar keeps records of the number of credit hours students complete each semester. The data she collects are summarized in the histogram.
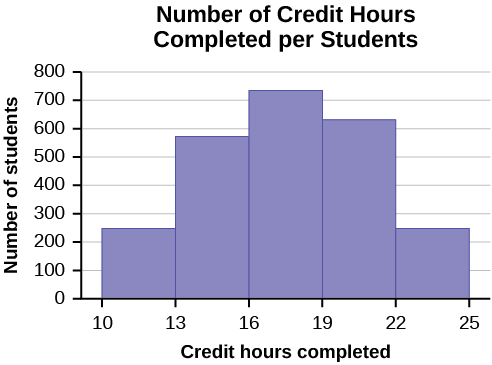
What type of data does this graph show?
- Answer
-
A histogram is used to display quantitative data: the numbers of credit hours completed.
Ordinal Variables
Ordinal variables are variables with an ordinal Scale of Measurement. This means that ordinal variables are variables that are in an order, but aren't exactly numbers that measure something. I often get shoe size as an example of a quantitative variable, but I really think that's it's ordinal. The numbers aren't measuring anything, but they are in an order.
Scale of measurement in which levels have an order; a type of variable that can be put in numerical order. The variables are in ranks (first, second, third, etc.).
For another example, I could look at students' letter grade on their final exam. Obviously, students who earn A's have a higher grade than students who earn any other letter grade, but I can't be sure that these letters (qualitative) map directly onto the grade percentages (quantiative). This makes me think that letter grades are ordinal; there is an order of highest to lowest in grades, but it's not a number. Similarly, I could look at everyone who's currently enrolled at the high school that you graduated from by their grade level. I could use numbers (9 for 9th graders), which would be quantitative. I could also use the names that we give them (freshman), and names are qualitative. However, there is an order to these grade levels (senior is higher than freshman) so this also feels like an ordinal variable to me.
Look up “ordinal variable” online. What is that definition? How is it similar or different from the one provided? Which makes more sense to you?
I wish it was more clear which type of variable was which! Don't worry too much, though, since we usually treat ordinal variables as quantitative variables in statistics.
Does the type of variable even matter?
The type of scale determines what specific statistical analysis you should use. I'm going to share a flow chart now that shows how knowing the type and number of variables (IVs and levels, and DVs) and whether they are related (dependent) or not related (independent) is how you choose which statistical analysis to choose: Decision Tree: Which Statistical Analysis? I know, that might be a little overwhelming right now! Dr. MO isn't sharing this to scare you, but to show how important knowing the type of variable will be when analyzing data statistically. Plus, it's easier to learn new material if you can connect it to something that you already know. You might want to print out the Decision Tree, then write notes on it when you learn about each type of analysis. That way, you can "hang" your new knowledge on the "tree" that you already have.
In good news, by the end of this book, you'll be familiar with all of these, and know how to compute most of them!
In bad news, statistical software will run what you ask, regardless of the measurement scale of the variable. If it’s a number, you can analyze it. When this happens with qualitative variables, the results are junk. If you say apple=1 and orange=2, it will find the average of an appleorange. Since that's not a thing, you're answer wouldn't mean anything. More reason to understand the different kinds of variables!