
8.9: Office Temperature
- Page ID
- 14498

Let’s do another example to solidify our understanding. Let’s say that the office building you work in is supposed to be kept at 74 degree Fahrenheit but is allowed to vary by 1 degree in either direction. You suspect that, as a cost saving measure, the temperature was secretly set higher. You set up a formal way to test your hypothesis.
Step 1: State the Hypotheses
You start by laying out the null hypothesis:
\(H_0\): The average building temperature is not higher than claimed
\(H_0: \mu \leq 74\)
Next you state the alternative hypothesis. You have reason to suspect a specific direction of change, so you make a one-tailed test:
\(H_A\): The average building temperature is higher than claimed
\(\mathrm{H}_{\mathrm{A}}: \mu>74\)
Step 2: Find the Critical Values
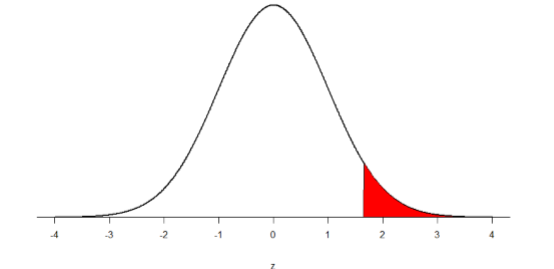
You know that the most common level of significance is \(α\) = 0.05, so you keep that the same and know that the critical value for a one-tailed \(z\)-test is \(z*\) = 1.645. To keep track of the directionality of the test and rejection region, you draw out your distribution:
Step 3: Calculate the Test Statistic
Now that you have everything set up, you spend one week collecting temperature data:
| Day | Temperature |
|---|---|
| Monday | 77 |
| Tuesday | 76 |
| Wednesday | 74 |
| Thursday | 78 |
| Friday | 78 |
You calculate the average of these scores to be \(M\)= 76.6 degrees. You use this to calculate the test statistic, using \(μ\) = 74 (the supposed average temperature), \(σ\) = 1.00 (how much the temperature should vary), and \(n\) = 5 (how many data points you collected):
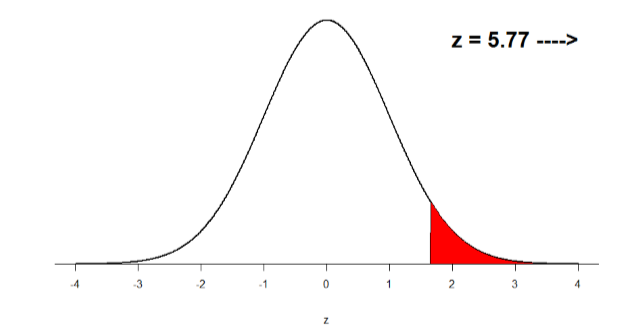
\[z=\dfrac{76.60-74.00}{1.00 / \sqrt{5}}=\dfrac{2.60}{0.45}=5.78 \nonumber \]
This value falls so far into the tail that it cannot even be plotted on the distribution!
Step 4: Make the Decision
You compare your obtained \(z\)-statistic, \(z\) = 5.77, to the critical value, \(z*\) = 1.645, and find that \(z > z*\). Therefore you reject the null hypothesis, concluding:
Based on 5 observations, the average temperature (\(M\)= 76.6 degrees) is statistically significantly higher than it is supposed to be, \(z\) = 5.77, \(p\) < .05.
Because the result is significant, you also calculate an effect size:
\[d=\dfrac{76.60-74.00}{1.00}=\dfrac{2.60}{1.00}=2.60 \nonumber \]
The effect size you calculate is definitely large, meaning someone has some explaining to do!
Contributors and Attributions
Foster et al. (University of Missouri-St. Louis, Rice University, & University of Houston, Downtown Campus)