

11.2: Goodness-of-Fit Test
- Page ID
- 11011

\( \newcommand{\vecs}[1]{\overset { \scriptstyle \rightharpoonup} {\mathbf{#1}} } \)
\( \newcommand{\vecd}[1]{\overset{-\!-\!\rightharpoonup}{\vphantom{a}\smash {#1}}} \)
\( \newcommand{\dsum}{\displaystyle\sum\limits} \)
\( \newcommand{\dint}{\displaystyle\int\limits} \)
\( \newcommand{\dlim}{\displaystyle\lim\limits} \)
\( \newcommand{\id}{\mathrm{id}}\) \( \newcommand{\Span}{\mathrm{span}}\)
( \newcommand{\kernel}{\mathrm{null}\,}\) \( \newcommand{\range}{\mathrm{range}\,}\)
\( \newcommand{\RealPart}{\mathrm{Re}}\) \( \newcommand{\ImaginaryPart}{\mathrm{Im}}\)
\( \newcommand{\Argument}{\mathrm{Arg}}\) \( \newcommand{\norm}[1]{\| #1 \|}\)
\( \newcommand{\inner}[2]{\langle #1, #2 \rangle}\)
\( \newcommand{\Span}{\mathrm{span}}\)
\( \newcommand{\id}{\mathrm{id}}\)
\( \newcommand{\Span}{\mathrm{span}}\)
\( \newcommand{\kernel}{\mathrm{null}\,}\)
\( \newcommand{\range}{\mathrm{range}\,}\)
\( \newcommand{\RealPart}{\mathrm{Re}}\)
\( \newcommand{\ImaginaryPart}{\mathrm{Im}}\)
\( \newcommand{\Argument}{\mathrm{Arg}}\)
\( \newcommand{\norm}[1]{\| #1 \|}\)
\( \newcommand{\inner}[2]{\langle #1, #2 \rangle}\)
\( \newcommand{\Span}{\mathrm{span}}\) \( \newcommand{\AA}{\unicode[.8,0]{x212B}}\)
\( \newcommand{\vectorA}[1]{\vec{#1}} % arrow\)
\( \newcommand{\vectorAt}[1]{\vec{\text{#1}}} % arrow\)
\( \newcommand{\vectorB}[1]{\overset { \scriptstyle \rightharpoonup} {\mathbf{#1}} } \)
\( \newcommand{\vectorC}[1]{\textbf{#1}} \)
\( \newcommand{\vectorD}[1]{\overrightarrow{#1}} \)
\( \newcommand{\vectorDt}[1]{\overrightarrow{\text{#1}}} \)
\( \newcommand{\vectE}[1]{\overset{-\!-\!\rightharpoonup}{\vphantom{a}\smash{\mathbf {#1}}}} \)
\( \newcommand{\vecs}[1]{\overset { \scriptstyle \rightharpoonup} {\mathbf{#1}} } \)
\(\newcommand{\longvect}{\overrightarrow}\)
\( \newcommand{\vecd}[1]{\overset{-\!-\!\rightharpoonup}{\vphantom{a}\smash {#1}}} \)
\(\newcommand{\ket}[1]{\left| #1 \right>}\)
\(\newcommand{\bra}[1]{\left< #1 \right|}\)
\(\newcommand{\braket}[2]{\left< #1 \vphantom{#2} \right| \left. #2 \vphantom{#1} \right>}\)
\(\newcommand{\braopket}[3]{\left< #1 \vphantom{#2}\vphantom{#3} \right| #2 \vphantom{#1}\vphantom{#3} \left| #3 \vphantom{#1}\vphantom{#2} \right>}\)
\(\newcommand{\qmvec}[1]{\mathbf{\vec{#1}}}\)
\(\newcommand{\op}[1]{\hat{\mathbf{#1}}}\)
\(\newcommand{\expect}[1]{\langle #1 \rangle}\)
\(\newcommand{\dfn}[1]{\emph{\textbf{#1}}}\)
Introduction
For this section and the next, we will explore how to identify relationships in categorized data. So far, we have only explored relationships with quantitative data in the form of the correlation coefficient. We will start with a single set of categorized data and how it measures up to our expectations. In the following section, we will compare categorized data sets to each other to search for a dependency and sameness between the sets.
But first, we need to explore a new distribution.
The Chi-Squared Distribution
The notation for the chi-square distribution is:
\[\chi \sim \chi^{2}_{df}\]
where \(df =\) degrees of freedom which depends on how chi-square is being used. (If you want to practice calculating chi-square probabilities then use \(df = n - 1\). The degrees of freedom for the three major uses are each calculated differently.)
For the \(\chi^{2}\) distribution, the population mean is \(\mu = df\) and the population standard deviation is
\[\sigma = \sqrt{2(df)}.\]
The random variable is shown as \(\chi^{2}\), but may be any upper case letter. The random variable for a chi-square distribution with \(k\) degrees of freedom is the sum of \(k\) independent, squared standard normal variables.
\[\chi^{2} = (Z_{1})^{2} + ... + (Z_{k})^{2}\]
- The curve is nonsymmetrical and skewed to the right.
- There is a different chi-square curve for each \(df\).
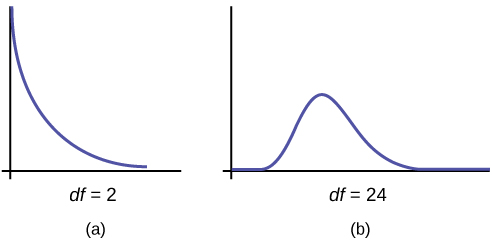
- The test statistic for any test is always greater than or equal to zero.
- When \(df > 90\), the chi-square curve approximates the normal distribution. For \(\chi \sim \chi^{2}_{1,000}\) the mean, \(\mu = df = 1,000\) and the standard deviation, \(\mu = \sqrt{2(1,000)}\). Therefore, \(X \sim N(1,000, 44.7)\), approximately.
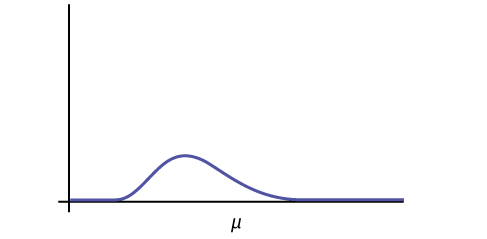
- The mean, \(\mu\), is located just to the right of the peak.
Goodness-of-Fit Test
We will follow the same five steps as earlier chapters:
- Setup the Hypotheses
- Find the test statistic
- Find the Critical Value or the p-value
- Note: Even though the table for the Chi-Squared Distribution exist, we will focus on the technology use and p-value method in these examples.
- Make a Decision about \(H_0\)
- State the Conclusion.
In this type of hypothesis test, you determine whether the data "fit" a particular distribution or not. For example, you may suspect your unknown data fit a binomial distribution. You use a chi-square test called the Goodness-of-Fit to determine if there is a fit or not.
The null and the alternative hypotheses for this test may be written in sentences or may be stated as equations or inequalities.
For example:
\(H_{0}\): There is no preference shown (This is "equality" since we are saying that if there is no preference, what we observe and what we expect should be the same.)
\(H_{1}\): There is a preference shown (The alternative hypothesis is the complement of the null hypothesis.)
or if we are given a list of expected proportions, then we could do something like:
\(H_{0}\): \(p_1 = a\), \(p_1 = b\), \(p_1 = c\) (where a, b, and c are the given proportion values.)
\(H_{1}\): At least one of the preferences is different. (Note: The complement of the null hypothesis is not that none of them match, but that at least one of does not match.)
The test statistic for a goodness-of-fit test is:
\[\chi^2 =\sum_k \frac{(O - E)^{2}}{E}\]
where:
- The Greek letter, \(chi\), for this distribution and the name of our Test Statistic, just like we would use \(z\) or \(t\).
- \(O =\) observed values (data)
- \(E =\) expected values (from theory)
- \(k =\) the number of different data cells or categories
If needed, this test statistic is traditionally rounded to two decimal places. This is due to the chi-squared distribution table using the same place value.
The observed values are the data values and the expected values are the values you would expect to get if the null hypothesis were true. There are \(n\) terms of the form \(\frac{(O - E)^{2}}{E}\).
The Critical Value and p-value are found using chi-square distribution.
The number of degrees of freedom is \(df = (\text{number of categories} - 1)\).
The goodness-of-fit test is almost always right-tailed. If the observed values and the corresponding expected values are not close to each other, then the test statistic can get very large and will be way out in the right tail of the chi-square curve.
The expected value for each cell needs to be at least five in order for you to use this test.
Absenteeism of college students from math classes is a major concern to math instructors because missing class appears to increase the drop rate. Suppose that a study was done to determine if the actual student absenteeism rate follows faculty perception. The faculty expected that a group of 100 students would miss class according to the table below.
| Number of absences per term | Expected number of students |
|---|---|
| 0–2 | 50 |
| 3–5 | 30 |
| 6–8 | 12 |
| 9–11 | 6 |
| 12+ | 2 |
A random survey across all mathematics courses was then done to determine the actual number (observed) of absences in a course. The chart in the table below displays the results of that survey.
| Number of absences per term | Actual number of students |
|---|---|
| 0–2 | 35 |
| 3–5 | 40 |
| 6–8 | 20 |
| 9–11 | 1 |
| 12+ | 4 |
a. Determine the null and alternative hypotheses needed to conduct a goodness-of-fit test.
- \(H_{0}\): Student absenteeism fits faculty perception.
- \(H_{1}\): Student absenteeism does not fit faculty perception.
b. Can you use the information as it appears in the charts to conduct the goodness-of-fit test?
No. Notice that the expected number of absences for the "12+" entry is less than five (it is two). Combine that group with the "9–11" group to create new tables where the number of students for each entry are at least five. The new results are in the table below.
| Number of absences per term | Expected number of students |
|---|---|
| 0–2 | 50 |
| 3–5 | 30 |
| 6–8 | 12 |
| 9+ | 8 |
| Number of absences per term | Actual number of students |
|---|---|
| 0–2 | 35 |
| 3–5 | 40 |
| 6–8 | 20 |
| 9+ | 5 |
c. What is the number of degrees of freedom (\(df\))?
There are four "cells" or categories in each of the new tables.
\(df = \text{number of cells} - 1 = 4 - 1 = 3\)
A factory manager needs to understand how many products are defective versus how many are produced. The number of expected defects is listed in the table below.
| Number produced | Number defective |
|---|---|
| 0–100 | 5 |
| 101–200 | 6 |
| 201–300 | 7 |
| 301–400 | 8 |
| 401–500 | 10 |
A random sample was taken to determine the actual number of defects. The table below shows the results of the survey.
| Number produced | Number defective |
|---|---|
| 0–100 | 5 |
| 101–200 | 7 |
| 201–300 | 8 |
| 301–400 | 9 |
| 401–500 | 11 |
State the null and alternative hypotheses needed to conduct a goodness-of-fit test, and state the degrees of freedom.
- Answer
-
\(H_{0}\):The number of defects fits expectations.
\(H_{1}\):The number of defects does not fit expectations.
\(df = 4\)
Employers want to know which days of the week employees are absent in a five-day work week. Most employers would like to believe that employees are absent equally during the week. Suppose a random sample of 60 managers were asked on which day of the week they had the highest number of employee absences. The results were distributed as in the table below. For the population of employees, do the days for the highest number of absences occur with equal frequencies during a five-day work week? Test at a 5% significance level.
| Monday | Tuesday | Wednesday | Thursday | Friday | |
|---|---|---|---|---|---|
| Number of Absences | 15 | 12 | 9 | 9 | 15 |
Solution
Step 1:
The null and alternative hypotheses are:
- \(H_{0}\): The absent days occur with equal frequencies, that is, they fit a uniform distribution.
- \(H_{1}\): The absent days occur with unequal frequencies, that is, they do not fit a uniform distribution.
Step 2:
If the absent days occur with equal frequencies, then, out of 60 absent days (the total in the sample: \(15 + 12 + 9 + 9 + 15 = 60\)), there would be 12 absences on Monday, 12 on Tuesday, 12 on Wednesday, 12 on Thursday, and 12 on Friday. These numbers are the expected (\(E\)) values. The values in the table are the observed (\(O\)) values or data.
Calculate the \(\chi^{2}\) test statistic. We can make a chart to keep track of the information and steps:
| Observed (\(O\)) | Expected (\(E\)) | \((O – E)\) | \((O – E)^{2}\) | \(\frac{(O - E)^{2}}{E}\) |
|---|---|---|---|---|
| 15 | 12 | 3 | 9 | 0.75 |
| 12 | 12 | 0 | 0 | 0.75 |
| 9 | 12 | -3 | 9 | 0.75 |
| 9 | 12 | -3 | 9 | 0.75 |
| 15 | 12 | 3 | 9 | 0.75 |
Now add (sum) the last column.
\(\chi^2 =\sum_k \frac{(O - E)^{2}}{E} = 3\)
This is the \(\chi^{2}\) test statistic.
Step 3:
To find the p-value, calculate \(P(\chi^{2} > 3)\). This test is right-tailed. (Use a computer or calculator to find the p-value. You should get \(p\text{-value} = 0.5578\).)
The \(dfs\) are the \(\text{number of cells} - 1 = 5 - 1 = 4\)
Press 2nd DISTR. Arrow down to \(\chi^{2}\)cdf. Press ENTER. Enter(3,10^99,4). Rounded to four decimal places, you should see 0.5578, which is the \(p\text{-value}\).
Step 4: Compare the p-value to the significance level, \(\alpha\).
\(0.5578 > 0.05\) The decision is not to reject the null hypothesis, \(H_0\).
Step 5:
Conclusion: At a 5% level of significance, from the sample data, there is not sufficient evidence to support that the absent days do not occur with equal frequencies.
Note: TI-83+ and some TI-84 calculators do not have a special program for the test statistic for the goodness-of-fit test. The newer TI-84 calculators have in STAT TESTS the test Chi2 GOF. To run the test, put the observed values (the data) into a first list and the expected values (the values you expect if the null hypothesis is true) into a second list. Press STAT TESTS and Chi2 GOF. Enter the list names for the Observed list and the Expected list. Enter the degrees of freedom and press calculate or draw. Make sure you clear any lists before you start. To Clear Lists in the calculators: Go into STAT EDIT and arrow up to the list name area of the particular list. Press CLEAR and then arrow down. The list will be cleared. Alternatively, you can press STAT and press 4 (for ClrList). Enter the list name and press ENTER.
As always, consult your instructor to determine if you can use the calculator function on your work.
Teachers want to know which night each week their students are doing most of their homework. Most teachers think that students do homework equally throughout the week. Suppose a random sample of 49 students were asked on which night of the week they did the most homework. The results were distributed as in the table below.
| Sunday | Monday | Tuesday | Wednesday | Thursday | Friday | Saturday | |
|---|---|---|---|---|---|---|---|
| Number of Students | 11 | 8 | 10 | 7 | 10 | 5 | 5 |
From the population of students, do the nights for the highest number of students doing the majority of their homework occur with equal frequencies during a week? What type of hypothesis test should you use?
- Answer
-
Since we are looking at categorized data and asking if what we expect is what we observe, we should use the Goodness-of-Fit test.
Step 1:
- \(H_{0}\): The homework nights occur with equal frequencies through out the week.
- \(H_{1}\): The homework nights do not occur with equal frequencies throughout the week.
Step 2:
\(E = \dfrac{\Sigma f}{k} = \dfrac{49}{7} = 7\) Note: If E ever needs rounding, then typically one decimal place is used.
Step 3:
\(df =k - 1 = 7 - 1= 6\)
\(p\text{-value} = 0.6093\)
Step 4:
\(0.6093 > 0.05\) The decision is not to reject the null hypothesis, \(H_0\).
Step 5:
Conclusion: Using a significance level of 0.05, there is not enough evidence to support that students do not do the majority of their homework equally throughout the week.
One study indicates that the number of televisions that American families have is distributed (this is the given distribution for the American population) as in the table below.
| Number of Televisions | Percent |
|---|---|
| 0 | 10 |
| 1 | 16 |
| 2 | 55 |
| 3 | 11 |
| 4+ | 8 |
The table contains expected (\(E\)) percents.
A random sample of 600 families in the far western United States resulted in the data in the table below.
| Number of Televisions | Frequency |
|---|---|
| Total = 600 | |
| 0 | 66 |
| 1 | 119 |
| 2 | 340 |
| 3 | 60 |
| 4+ | 15 |
The table contains observed (\(O\)) frequency values.
At the 1% significance level, does it appear that the distribution "number of televisions" of far western United States families is different from the distribution for the American population as a whole?
Solutions
This problem asks you to test whether the far western United States families distribution fits the distribution of the American families. Reminder: This test is always right-tailed.
Step 1:
\(H_{0}\): The "number of televisions" distribution of far western United States families is the same as the "number of televisions" distribution of the American population.
\(H_{1}\): The "number of televisions" distribution of far western United States families is different from the "number of televisions" distribution of the American population.
Alternately you could also write these as:
\(H_{0}\): \(p_0=0.10\), \(p_1=0.16\), \(p_2=0.55\), \(p_3=0.60\), \(p_{4+}=0.15\)
\(H_{1}\): At least one of the stated percentages is different.
Step 2:
The first table contains expected percentages. To get expected (E) frequencies, multiply the percentage by 600. The expected frequencies are shown in the table below.
| Number of Televisions | Percent | Expected Frequency |
|---|---|---|
| 0 | 10 | (0.10)(600) = 60 |
| 1 | 16 | (0.16)(600) = 96 |
| 2 | 55 | (0.55)(600) = 330 |
| 3 | 11 | (0.11)(600) = 66 |
| 4+ | 8 | (0.08)(600) = 48 |
Therefore, the expected frequencies are 60, 96, 330, 66, and 48. In the TI calculators, you can let the calculator do the math. For example, instead of 60, enter \(0.10*600\).
| Observed (\(O\)) | Expected (\(E\)) | \((O – E)\) | \((O – E)^{2}\) | \(\frac{(O - E)^{2}}{E}\) |
|---|---|---|---|---|
| 66 | 60 | 6 | 36 | 0.6 |
| 119 | 96 | 23 | 529 | 5.5104167 |
| 340 | 330 | 10 | 100 | 0.3030303 |
| 60 | 66 | -6 | 36 | 0.54545454 |
| 15 | 48 | -33 | 1089 | 22.6875 |
Now add (sum) the last column.
\(\chi^2 =\sum_k \frac{(O - E)^{2}}{E} = 29.6464015...\approx 29.65\)
Step 4:
Distribution for the test: \(\chi^{2}_{4}\) where \(df = k - 1 = 5 - 1 = 4\).
\(p\text{-value} = 0.000006\) and \(\alpha = 0.01\)
\(0.000006 \leq 0.01\), so we reject \(H_{0}\).
This means you reject the belief that the distribution for the far western states is the same as that of the American population as a whole.
Step 5:
Conclusion: At the 1% significance level, from the data, there is sufficient evidence to conclude that the "number of televisions" distribution for the far western United States is different from the "number of televisions" distribution for the American population as a whole.
Press STAT and ENTER. Make sure to clear lists L1, L2, and L3 if they have data in them. Into L1, put the observed frequencies 66, 119, 349, 60, 15. Into L2, put the expected frequencies .10*600, .16*600, .55*600, .11*600, .08*600. Arrow over to list L3 and up to the name area "L3". Enter (L1-L2)^2/L2 and ENTER. Press 2nd QUIT. Press 2nd LIST and arrow over to MATH. Press 5. You should see "sum" (Enter L3). Rounded to 2 decimal places, you should see 29.65. Press 2nd DISTR. Press 7 or Arrow down to 7:χ2cdf and press ENTER. Enter (29.65,1E99,4). Rounded to four places, you should see 5.77E-6 = .000006(rounded to six decimal places), which is the p-value.
The newer TI-84 calculators have in STAT TESTS the test Chi2 GOF. To run the test, put the observed values (the data) into a first list and the expected values (the values you expect if the null hypothesis is true) into a second list. Press STAT TESTS and Chi2 GOF. Enter the list names for the Observed list and the Expected list. Enter the degrees of freedom and press calculate or draw. Make sure you clear any lists before you start.
The expected percentage of the number of pets students have in their homes is distributed (this is the given distribution for the student population of the United States) as in the table below.
| Number of Pets | Percent |
|---|---|
| 0 | 18 |
| 1 | 25 |
| 2 | 30 |
| 3 | 18 |
| 4+ | 9 |
A random sample of 1,000 students from the Eastern United States resulted in the data in the table below.
| Number of Pets | Frequency |
|---|---|
| 0 | 210 |
| 1 | 240 |
| 2 | 320 |
| 3 | 140 |
| 4+ | 90 |
At the 1% significance level, does it appear that the distribution “number of pets” of students in the Eastern United States is different from the distribution for the United States student population as a whole? What is the \(p\text{-value}\)?
Answer
Step 1:
\(H_{0}\): The "number of pets" distribution of far eastern United States families is the same as the "number of pets" distribution of the American population.
\(H_{1}\): The "number of pets" distribution of far eastern United States families is different from the "number of pets" distribution of the American population.
Alternately you could also write these as:
\(H_{0}\): \(p_0=0.18\), \(p_1=0.25\), \(p_2=0.30\), \(p_3=0.18\), \(p_{4+}=0.09\)
\(H_{1}\): At least one of the stated percentages is different.
Step 2:
\(E = \dfrac{\Sigma f}{k} = 15.62\)
Step 3:
\(df =k - 1 = 5 - 1= 4\)
\(p\text{-value} = 0.0036\)
Step 4:
\(0.0036 \leq 0.01\) The decision is to reject the null hypothesis, \(H_0\).
Step 5:
Conclusion: Using a significance level of 0.01, there is sufficient evidence to conclude that the distribution “number of pets” of students in the Eastern United States is different from the distribution for the United States student population as a whole.
Suppose you flip two coins 100 times. The results are 20 HH, 27 HT, 30 TH, and 23 TT. Are the coins fair? Test at a 5% significance level.
Solution
This problem can be set up as a goodness-of-fit problem. The sample space for flipping two fair coins is \({HH, HT, TH, TT}\). Out of 100 flips, you would expect 25 HH, 25 HT, 25 TH, and 25 TT. This is the expected distribution. The question, "Are the coins fair?" is the same as saying, "Does the distribution of the coins (\(20 HH, 27 HT, 30 TH, 23 TT\)) fit the expected distribution?"
Random Variable: Let \(X =\) the number of heads in one flip of the two coins. \(X\) takes on the values 0, 1, 2. (There are 0, 1, or 2 heads in the flip of two coins.) Therefore, the number of categories is three.
Since \(X =\) the number of heads, the observed frequencies are 20 (for two heads), 57 (for one head), and 23 (for zero heads or both tails).
The expected frequencies are 25 (for two heads), 50 (for one head), and 25 (for zero heads or both tails). This test is right-tailed.
Step 1:
\(H_{0}\): The coins are fair.
\(H_{a}\): The coins are not fair.
Step 2:
Calculate the test statistic: \(\chi^{2} = 2.14\)
Step 3:
\(df = 3 - 1 = 2\).
\(p\text{-value} = 0.3430\)
Step 4:
\(\alpha = 0.05\) \(p\text{-value} = 0.3430\)
\(0.3430 > 0.05\).Do not reject \(H_{0}\).
Step 5:
Conclusion: Using a significance level of 5%, there is insufficient evidence to conclude that the coins are not fair.
Press STAT and ENTER. Make sure you clear lists L1, L2, and L3 if they have data in them. Into L1, put the observed frequencies 20, 57, 23. Into L2, put the expected frequencies 25, 50, 25. Arrow over to list L3 and up to the name area "L3". Enter (L1-L2)^2/L2 and ENTER. Press 2nd QUIT. Press 2nd LIST and arrow over to MATH. Press 5. You should see "sum".Enter L3. Rounded to two decimal places, you should see 2.14. Press 2nd DISTR. Arrow down to 7:χ2cdf (or press 7). Press ENTER. Enter 2.14,1E99,2). Rounded to four places, you should see .3430, which is the p-value.
The newer TI-84 calculators have in STAT TESTS the test Chi2 GOF. To run the test, put the observed values (the data) into a first list and the expected values (the values you expect if the null hypothesis is true) into a second list. Press STAT TESTS and Chi2 GOF. Enter the list names for the Observed list and the Expected list. Enter the degrees of freedom and press calculate or draw. Make sure you clear any lists before you start.
Students in a social studies class hypothesize that the literacy rates across the world for every region are 82%. The table below shows the actual literacy rates across the world broken down by region. What are the test statistic and the degrees of freedom?
| MDG Region | Adult Literacy Rate (%) |
|---|---|
| Developed Regions | 99.0 |
| Commonwealth of Independent States | 99.5 |
| Northern Africa | 67.3 |
| Sub-Saharan Africa | 62.5 |
| Latin America and the Caribbean | 91.0 |
| Eastern Asia | 93.8 |
| Southern Asia | 61.9 |
| South-Eastern Asia | 91.9 |
| Western Asia | 84.5 |
| Oceania | 66.4 |
Answer
\(df = 9\)
\(\chi^{2} \text{ test statistic} = 26.38\)
Press STAT and ENTER. Make sure you clear lists L1, L2, and L3 if they have data in them. Into L1, put the observed frequencies 99, 99.5, 67.3, 62.5, 91, 93.8, 61.9, 91.9, 84.5, 66.4. Into L2, put the expected frequencies 82, 82, 82, 82, 82, 82, 82, 82, 82, 82. Arrow over to list L3 and up to the name area "L3". Enter (L1-L2)^2/L2 and ENTER. Press 2nd QUIT. Press 2nd LIST and arrow over to MATH. Press 5. You should see "sum". Enter L3. Rounded to two decimal places, you should see 26.38. Press 2nd DISTR. Arrow down to 7:χ2cdf(or press 7). Press ENTER. Enter 26.38,1E99,9). Rounded to four places, you should see .0018, which is the p-value.
The newer TI-84 calculators have in STAT TESTS the test Chi2 GOF. To run the test, put the observed values (the data) into a first list and the expected values (the values you expect if the null hypothesis is true) into a second list. Press STAT TESTS and Chi2 GOF. Enter the list names for the Observed list and the Expected list. Enter the degrees of freedom and press calculate or draw. Make sure you clear any lists before you start.
References
- Data from Parade Magazine.
- “HIV/AIDS Epidemiology Santa Clara County.”Santa Clara County Public Health Department, May 2011.
- Data from the U.S. Census Bureau
- Data from the College Board. Available online at http://www.collegeboard.com.
- Data from the U.S. Census Bureau, Current Population Reports.
- Ma, Y., E.R. Bertone, E.J. Stanek III, G.W. Reed, J.R. Hebert, N.L. Cohen, P.A. Merriam, I.S. Ockene, “Association between Eating Patterns and Obesity in a Free-living US Adult Population.” American Journal of Epidemiology volume 158, no. 1, pages 85-92.
- Ogden, Cynthia L., Margaret D. Carroll, Brian K. Kit, Katherine M. Flegal, “Prevalence of Obesity in the United States, 2009–2010.” NCHS Data Brief no. 82, January 2012. Available online at http://www.cdc.gov/nchs/data/databriefs/db82.pdf (accessed May 24, 2013).
- Stevens, Barbara J., “Multi-family and Commercial Solid Waste and Recycling Survey.” Arlington Count, VA. Available online at www.arlingtonva.us/department.../file84429.pdf (accessed May 24,2013).
Review
The chi-square distribution is a useful tool for assessment in a series of problem categories. These problem categories include primarily (i) whether a data set fits a particular distribution, (ii) whether the distributions of two populations are the same, (iii) whether two events might be independent, and (iv) whether there is a different variability than expected within a population.
An important parameter in a chi-square distribution is the degrees of freedom \(df\) in a given problem. The random variable in the chi-square distribution is the sum of squares of df standard normal variables, which must be independent. The key characteristics of the chi-square distribution also depend directly on the degrees of freedom.
The chi-square distribution curve is skewed to the right, and its shape depends on the degrees of freedom \(df\). For \(df > 90\), the curve approximates the normal distribution. Test statistics based on the chi-square distribution are always greater than or equal to zero. Such application tests are almost always right-tailed tests.
To assess whether a data set fits a specific distribution, you can apply the goodness-of-fit hypothesis test that uses the chi-square distribution. The null hypothesis for this test states that the data come from the assumed distribution. The test compares observed values against the values you would expect to have if your data followed the assumed distribution. The test is almost always right-tailed. Each observation or cell category must have an expected value of at least five.
Formula Review
\[\chi^{2} = (Z_{1})^{2} + (Z_{2})^{2} + ... + (Z_{df})^{2}\] chi-square distribution random variable
\(\mu_{\chi^{2}} = df\) chi-square distribution population mean
\(\sigma_{\chi^{2}} = \sqrt{2(df)}\) Chi-Square distribution population standard deviation
\(\sum_k \frac{(O - E)^{2}}{E}\) goodness-of-fit test statistic where:
\(O\): observed values
\(E\): expected value
\(k\): number of different data cells or categories
\(df = k - 1\) degrees of freedom