

8.4: Hypothesis Tests for Means with Unknown Population Standard Deviation
- Page ID
- 11532

\( \newcommand{\vecs}[1]{\overset { \scriptstyle \rightharpoonup} {\mathbf{#1}} } \)
\( \newcommand{\vecd}[1]{\overset{-\!-\!\rightharpoonup}{\vphantom{a}\smash {#1}}} \)
\( \newcommand{\dsum}{\displaystyle\sum\limits} \)
\( \newcommand{\dint}{\displaystyle\int\limits} \)
\( \newcommand{\dlim}{\displaystyle\lim\limits} \)
\( \newcommand{\id}{\mathrm{id}}\) \( \newcommand{\Span}{\mathrm{span}}\)
( \newcommand{\kernel}{\mathrm{null}\,}\) \( \newcommand{\range}{\mathrm{range}\,}\)
\( \newcommand{\RealPart}{\mathrm{Re}}\) \( \newcommand{\ImaginaryPart}{\mathrm{Im}}\)
\( \newcommand{\Argument}{\mathrm{Arg}}\) \( \newcommand{\norm}[1]{\| #1 \|}\)
\( \newcommand{\inner}[2]{\langle #1, #2 \rangle}\)
\( \newcommand{\Span}{\mathrm{span}}\)
\( \newcommand{\id}{\mathrm{id}}\)
\( \newcommand{\Span}{\mathrm{span}}\)
\( \newcommand{\kernel}{\mathrm{null}\,}\)
\( \newcommand{\range}{\mathrm{range}\,}\)
\( \newcommand{\RealPart}{\mathrm{Re}}\)
\( \newcommand{\ImaginaryPart}{\mathrm{Im}}\)
\( \newcommand{\Argument}{\mathrm{Arg}}\)
\( \newcommand{\norm}[1]{\| #1 \|}\)
\( \newcommand{\inner}[2]{\langle #1, #2 \rangle}\)
\( \newcommand{\Span}{\mathrm{span}}\) \( \newcommand{\AA}{\unicode[.8,0]{x212B}}\)
\( \newcommand{\vectorA}[1]{\vec{#1}} % arrow\)
\( \newcommand{\vectorAt}[1]{\vec{\text{#1}}} % arrow\)
\( \newcommand{\vectorB}[1]{\overset { \scriptstyle \rightharpoonup} {\mathbf{#1}} } \)
\( \newcommand{\vectorC}[1]{\textbf{#1}} \)
\( \newcommand{\vectorD}[1]{\overrightarrow{#1}} \)
\( \newcommand{\vectorDt}[1]{\overrightarrow{\text{#1}}} \)
\( \newcommand{\vectE}[1]{\overset{-\!-\!\rightharpoonup}{\vphantom{a}\smash{\mathbf {#1}}}} \)
\( \newcommand{\vecs}[1]{\overset { \scriptstyle \rightharpoonup} {\mathbf{#1}} } \)
\(\newcommand{\longvect}{\overrightarrow}\)
\( \newcommand{\vecd}[1]{\overset{-\!-\!\rightharpoonup}{\vphantom{a}\smash {#1}}} \)
\(\newcommand{\ket}[1]{\left| #1 \right>}\)
\(\newcommand{\bra}[1]{\left< #1 \right|}\)
\(\newcommand{\braket}[2]{\left< #1 \vphantom{#2} \right| \left. #2 \vphantom{#1} \right>}\)
\(\newcommand{\braopket}[3]{\left< #1 \vphantom{#2}\vphantom{#3} \right| #2 \vphantom{#1}\vphantom{#3} \left| #3 \vphantom{#1}\vphantom{#2} \right>}\)
\(\newcommand{\qmvec}[1]{\mathbf{\vec{#1}}}\)
\(\newcommand{\op}[1]{\hat{\mathbf{#1}}}\)
\(\newcommand{\expect}[1]{\langle #1 \rangle}\)
\(\newcommand{\dfn}[1]{\emph{\textbf{#1}}}\)
Introduction
Now that we have a collection of tools to use, we are going to apply them to our population parameters:Mean, Proportion and Standard Deviation/Variance.
For the population parameter for the mean, we will review two cases much like we did with Confidence intervals.
When we do not know the population standard deviation, \(\sigma\) (sigma), which is more typical of most hypothesis tests, and the requirements for the hypothesis test are met, then we use Student T distribution, t-distribution, to calculate the critical values and the p-values for our test.
Requirements for the t-test:
- The sample observations are a simple random sample.
- Either or both of these conditions are satisfied: The population the sample comes from is normally distributed or our sample size is 30 or more, \(n \geq 20\).
For these t-tests, we can use the Traditional method, which focuses on a comparison of test statistic to critical value or the p-value method, which focuses on a comparison of the significance level to the p-value.
| Traditional Method: | P-Value Method |
|---|---|
| Step 1: Setup the Hypotheses using Symbolic Notation. | Step 1: Setup the Hypotheses using Symbolic Notation. |
| Step 2: Calculate the test statistic: \(t = \dfrac{\bar{x} - \mu}{\dfrac{s}{\sqrt{n}}}\) | Step 2: Calculate the test statistic: \(t = \dfrac{\bar{x} - \mu}{\dfrac{s}{\sqrt{n}}}\) |
| Step 3: Identify the critical value using table or technology and the test type (left tail, right tail, two tail) -- include the degrees of freedom (df) \(= n - 1\) | Step 3: Identify the p-value based on the table or technology and the test type (Left tail, right tail, two tail) -- include the degrees of freedom (df) \(= n - 1\) |
| Step 4: Compare Test statistic to Critical Value to make a decision regarding the null hypothesis, \(H_0\). | Step 4: Compare the p-value to the significance level to make a decision regarding the null hypothesis, \(H_0\). |
| Step 5: Summarize your results, include the significance level. | Step 5: Summarize your results, include the significance level. |
For Step 3: Traditional Method, to find the critical value using a TI 83/84, the command is:
- Left tail test: \(t_{\alpha,df} = \text{invT}(\alpha,df)\) -- Expect a negative critical value since an area of \(\alpha\) is on the left side of the distribution. Creating a critical region to its left.
- Right tail test: \(t_{\alpha,df} = \text{invT}(1 - \alpha),df\) -- Expect a positive critical value since an area of \(1 - \alpha\) is on the right side of the distribution. Creating a critical region to its right.
- Two tail test:\(t_{\frac{\alpha}{2},df} = \text{invT}(\frac{\alpha}{2},df)\) -- The significance is split symmetrically on both sides of the distribution, so we expect a negative and positive critical value, creating two critical regions, one in each tail.
For Step 3: p-value Method, to find the critical value using a TI 83/84, the command is:
- Left tail test: p-value = tcdf(\(-10^{99}\), Test Statistic,df) -- Left tail means we need the area to the left of the test statistic.
- Right tail test: p-value = tcdf(Test Statistic, \(-10^{99}\),df) -- Right tail means we need the area to the right of the test statistic.
- Two tail test: P-vaule = 2 \(\cdot\) tcdf(\(-10^{99}\), Test Statistic, df) if Test Statistic is negative and 2 \(\cdot\) tcdf(Test Statistic, \(-10^{99}\),df) if the Test Statistic is negative. We need to double the p-value since our significance level is split between the two tails.
If you prefer to use a t-distribution table (t-table), then you would follow a similar technique when identifying the values on the table.
For Step 4: Traditional Method - Compare a t-score to a t-score.
- If the test statistic is within the critical region, then reject the null hypothesis.
- In the case of a left tail test, we reject \(H_0\) when the test statistic is to the left of the critical value in the critical region.
- In the case of a right tail test, we reject \(H_0\) when the test statistic is to the right of the critical value in the critical region.
- In the case of a two tail test, we reject \(H_0\) when the test statistic is in the critical region, which is both tails of the distribution.
- If the test statistic is outside the critical region, then do not reject the null hypothesis.
For Step 4: P-value Method - Compare an area to an area
- If \(\text{p-value} \leq \alpha\), then reject the null hypothesis.
- If \(\text{p-value} > \alpha\), then do not reject the null hypothesis.
It is believed that a stock price for a particular company will grow at a rate of $5 per week with a standard deviation of $1. An investor believes the stock won’t grow as quickly. The changes in stock price is recorded for ten weeks and are as follows: $4, $3, $2, $3, $1, $7, $2, $1, $1, $2. Perform a hypothesis test using a 5% level of significance. State the null and alternative hypotheses, find the p-value, state your conclusion, and identify the Type I and Type II errors.
- Answer
-
- \(H_{0}: \mu = 5\)
- \(H_{1}: \mu < 5\)
- \(p = 0.0082\)
Because \(p < \alpha\), we reject the null hypothesis. There is sufficient evidence to suggest that the stock price of the company grows at a rate less than $5 a week.
- Type I Error: To conclude that the stock price is growing slower than $5 a week when, in fact, the stock price is growing at $5 a week (reject the null hypothesis when the null hypothesis is true).
- Type II Error: To conclude that the stock price is growing at a rate of $5 a week when, in fact, the stock price is growing slower than $5 a week (do not reject the null hypothesis when the null hypothesis is false).
Full Hypothesis Test Examples
Statistics students believe that the mean score on the first statistics test is 65. A statistics instructor thinks the mean score is higher than 65. He samples ten statistics students and obtains the scores 65 65 70 67 66 63 63 68 72 71. He performs a hypothesis test using a 5% level of significance. The data are assumed to be from a normal distribution.
Solution
Step 1: Set up the Hypothesis Test:
A 5% level of significance means that \(\alpha = 0.05\). This is a test of a single population mean.
\(H_{0}: \mu = 65 H_{1}: \mu > 65\)
Since the instructor thinks the average score is higher, use a "\(>\)". The "\(>\)" means the test is right-tailed.
Determine the distribution needed:
Random variable: \(\bar{X} =\) average score on the first statistics test.
Distribution for the test: If you read the problem carefully, you will notice that there is no population standard deviation given. You are only given \(n = 10\) sample data values. Notice also that the data come from a normal distribution. This means that the distribution for the test is a student's \(t\).
Step 2: Find the Test Statistic:
\(t = \dfrac{\bar{x} - \mu}{\dfrac{s}{\sqrt{n}}}\)
\(\mu = 65\) comes from \(H_{0}\) and not the data. Let's find the sample mean and standard deviation using 1-Var Stat in our TI - 83/84 (other technology)
Sample Mean: \(\bar{x} =67) Sample Standard Deviation: \(s = 3.1972\) Number of Samples: \(n =10\)
\(t = \dfrac{67 - 65}{\dfrac{3.1972}{\sqrt{10}}}\)
\(t=1.97815...\approx 1.978\)
Step 3: Find the Critical value or the p-value
| Traditional Method | p-value method |
|---|---|
|
Use \(t_{\alpha,df}\). Therefore, the distribution for the test is \(t_{0.05,9}\) where \(n = 10\) and \(df = 10 - 1 = 9\). \(t_{\alpha,df} = \text{invT}(\alpha),df\) \(t_{0.05,9} = \text{invT}(1 - 0.05,9)\) = 1.83311... \(t_{0.05,9} \approx 1.833\) |
p-value = tcdf(Test Statistic,\(10^{99}\),df) p-value = tcdf(1.978,\(10^{99}\), 9) = 0.03965726... p-value \(\approx\) 0.0397 |
Step 4: Make a decision
| Traditional Method | p-value method |
|---|---|

Since we are just comparing t-scores, there is no need to draw the area of our normal curve. The number line with with the critical region shaded is enough to see that the Test Statistic (TS on the number line) is inside the critical region which is to the left of the Critical Value. We reject the null hypothesis, \(H_{0}\). |
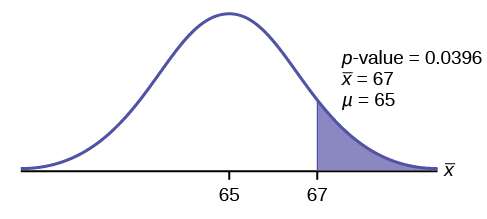
We compare the area to the left of the test statistic to the area to the left of the significance level. (Note: The p-value in the image above was found using a more exact set of statistics.) p-value vs. \(\alpha\) 0.0397 \(\leq\) 0.05 We reject the null hypothesis, \(H_{0}\). Interpretation of the p-value: If the null hypothesis is true, then there is a 0.0396 probability (3.96%) that the sample mean is 65 or more. Because a 3.96% chance is small, the mean score of 65 or more is unlikely to have happened randomly. |
Step 5: Summarize the results.
Conclusion: At a 5% level of significance, the sample data show sufficient evidence that the mean (average) test score is more than 65, just as the math instructor thinks.
The \(p\text{-value}\) can easily be calculated using the TI 83 or 84 T-Test. Consult your instructor before using it.
Put the data into a list. Press STAT and arrow over to TESTS. Press 2:T-Test. Arrow over to Data and press ENTER. Arrow down and enter 65 for \(\mu_{0}\), the name of the list where you put the data, and 1 for Freq:. Arrow down to \(\mu\): and arrow over to \(> \mu_{0}\). Press ENTER. Arrow down to Calculate and pressENTER. The calculator not only calculates the \(p\text{-value}\) (p = 0.0396) but it also calculates the test statistic (t-score) for the sample mean, the sample mean, and the sample standard deviation. \(\mu > 65\) is the alternative hypothesis. Do this set of instructions again except arrow to Draw (instead of Calculate). Press ENTER. A shaded graph appears with \(t = 1.9781\) (test statistic) and \(p = 0.0396\) (\(p\text{-value}\)). Make sure when you use Draw that no other equations are highlighted in \(Y =\) and the plots are turned off.
The National Institute of Standards and Technology provides exact data on conductivity properties of materials. Following are conductivity measurements for 11 randomly selected pieces of a particular type of glass.
1.11; 1.07; 1.11; 1.07; 1.12; 1.08; .98; .98 1.02; .95; .95
Is there convincing evidence that the average conductivity of this type of glass is greater than one? Use a significance level of 0.05. Assume the population is normal.
- Answer
-
Let’s follow our steps to answer this statistical question.
Step 1: Set up the Hypothesis Test:
We need to determine if, at a 0.05 significance level, the average conductivity of the selected glass is greater than one. Our hypotheses will be
\(H_{0}: \mu \leq 1\)
\(H_{1}: \mu > 1\)
The \(>\) in our alternate hypothesis tells us this is a right-tail test.
Step 2: Find the Test Statistic: \(t = 2.013777... \approx 2.014\) - Step 3: Find the Critical value or the p-value
-
Traditional vs. P-Value Method Traditional Method P-Value Method \(t_{0.05,10} = \text{invT}(1 - 0.05,10)\) = 1.81246...
\(t_{0.05,10} \approx 1.812\)
p-value = 0.0359
Step 4: Make a decision
Traditional Method P-Value Method Reject \(H_0\). The Test Statistic is in the Critical Region to the right of the Critical Value.
p-value vs. \(\alpha\)
0.0359 \(\leq\) 0.05
We reject the null hypothesis, \(H_{0}\).
Step 5: Summarize the results.
Conclusions: Since the \(p\text{-value} (p = 0.036)\) is less than our alpha value, we will reject the null hypothesis. It is reasonable to state that the data supports the claim that the average conductivity level is greater than one.
Review
The hypothesis test itself has an established process. This can be summarized as follows:
- Determine \(H_{0}\) and \(H_{a}\). Remember, they are contradictory.
- Determine the random variable.
- Determine the distribution for the test.
- Draw a graph, calculate the test statistic, and use the test statistic to calculate the \(p\text{-value}\). (A z-score and a t-score are examples of test statistics.)
- Compare the preconceived α with the p-value, make a decision (reject or do not reject H0), and write a clear conclusion using English sentences.
Notice that in performing the hypothesis test, you use \(\alpha\) and not \(\beta\). \(\beta\) is needed to help determine the sample size of the data that is used in calculating the \(p\text{-value}\). Remember that the quantity \(1 – \beta\) is called the Power of the Test. A high power is desirable. If the power is too low, statisticians typically increase the sample size while keeping α the same.If the power is low, the null hypothesis might not be rejected when it should be.
References
- Data from Amit Schitai. Director of Instructional Technology and Distance Learning. LBCC.
- Data from Bloomberg Businessweek. Available online at http://www.businessweek.com/news/2011- 09-15/nyc-smoking-rate-falls-to-record-low-of-14-bloomberg-says.html.
- Data from energy.gov. Available online at http://energy.gov (accessed June 27. 2013).
- Data from Gallup®. Available online at www.gallup.com (accessed June 27, 2013).
- Data from Growing by Degrees by Allen and Seaman.
- Data from La Leche League International. Available online at www.lalecheleague.org/Law/BAFeb01.html.
- Data from the American Automobile Association. Available online at www.aaa.com (accessed June 27, 2013).
- Data from the American Library Association. Available online at www.ala.org (accessed June 27, 2013).
- Data from the Bureau of Labor Statistics. Available online at http://www.bls.gov/oes/current/oes291111.htm.
- Data from the Centers for Disease Control and Prevention. Available online at www.cdc.gov (accessed June 27, 2013)
- Data from the U.S. Census Bureau, available online at quickfacts.census.gov/qfd/states/00000.html (accessed June 27, 2013).
- Data from the United States Census Bureau. Available online at www.census.gov/hhes/socdemo/language/.
- Data from Toastmasters International. Available online at http://toastmasters.org/artisan/deta...eID=429&Page=1.
- Data from Weather Underground. Available online at www.wunderground.com (accessed June 27, 2013).
- Federal Bureau of Investigations. “Uniform Crime Reports and Index of Crime in Daviess in the State of Kentucky enforced by Daviess County from 1985 to 2005.” Available online at http://www.disastercenter.com/kentucky/crime/3868.htm (accessed June 27, 2013).
- “Foothill-De Anza Community College District.” De Anza College, Winter 2006. Available online at research.fhda.edu/factbook/DA...t_da_2006w.pdf.
- Johansen, C., J. Boice, Jr., J. McLaughlin, J. Olsen. “Cellular Telephones and Cancer—a Nationwide Cohort Study in Denmark.” Institute of Cancer Epidemiology and the Danish Cancer Society, 93(3):203-7. Available online at http://www.ncbi.nlm.nih.gov/pubmed/11158188 (accessed June 27, 2013).
- Rape, Abuse & Incest National Network. “How often does sexual assault occur?” RAINN, 2009. Available online at www.rainn.org/get-information...sexual-assault (accessed June 27, 2013).
Glossary
- Central Limit Theorem
- Given a random variable (RV) with known mean \(\mu\) and known standard deviation \(\sigma\). We are sampling with size \(n\) and we are interested in two new RVs - the sample mean, \(\bar{X}\), and the sample sum, \(\sum X\). If the size \(n\) of the sample is sufficiently large, then \(\bar{X} - N\left(\mu, \frac{\sigma}{\sqrt{n}}\right)\) and \(\sum X - N \left(n\mu, \sqrt{n}\sigma\right)\). If the size n of the sample is sufficiently large, then the distribution of the sample means and the distribution of the sample sums will approximate a normal distribution regardless of the shape of the population. The mean of the sample means will equal the population mean and the mean of the sample sums will equal \(n\) times the population mean. The standard deviation of the distribution of the sample means, \(\frac{\sigma}{\sqrt{n}}\), is called the standard error of the mean.
Contributors and Attributions
Barbara Illowsky and Susan Dean (De Anza College) with many other contributing authors. Content produced by OpenStax College is licensed under a Creative Commons Attribution License 4.0 license. Download for free at http://cnx.org/contents/30189442-699...b91b9de@18.114.