

6.1: Prelude
- Page ID
- 10941

\( \newcommand{\vecs}[1]{\overset { \scriptstyle \rightharpoonup} {\mathbf{#1}} } \)
\( \newcommand{\vecd}[1]{\overset{-\!-\!\rightharpoonup}{\vphantom{a}\smash {#1}}} \)
\( \newcommand{\dsum}{\displaystyle\sum\limits} \)
\( \newcommand{\dint}{\displaystyle\int\limits} \)
\( \newcommand{\dlim}{\displaystyle\lim\limits} \)
\( \newcommand{\id}{\mathrm{id}}\) \( \newcommand{\Span}{\mathrm{span}}\)
( \newcommand{\kernel}{\mathrm{null}\,}\) \( \newcommand{\range}{\mathrm{range}\,}\)
\( \newcommand{\RealPart}{\mathrm{Re}}\) \( \newcommand{\ImaginaryPart}{\mathrm{Im}}\)
\( \newcommand{\Argument}{\mathrm{Arg}}\) \( \newcommand{\norm}[1]{\| #1 \|}\)
\( \newcommand{\inner}[2]{\langle #1, #2 \rangle}\)
\( \newcommand{\Span}{\mathrm{span}}\)
\( \newcommand{\id}{\mathrm{id}}\)
\( \newcommand{\Span}{\mathrm{span}}\)
\( \newcommand{\kernel}{\mathrm{null}\,}\)
\( \newcommand{\range}{\mathrm{range}\,}\)
\( \newcommand{\RealPart}{\mathrm{Re}}\)
\( \newcommand{\ImaginaryPart}{\mathrm{Im}}\)
\( \newcommand{\Argument}{\mathrm{Arg}}\)
\( \newcommand{\norm}[1]{\| #1 \|}\)
\( \newcommand{\inner}[2]{\langle #1, #2 \rangle}\)
\( \newcommand{\Span}{\mathrm{span}}\) \( \newcommand{\AA}{\unicode[.8,0]{x212B}}\)
\( \newcommand{\vectorA}[1]{\vec{#1}} % arrow\)
\( \newcommand{\vectorAt}[1]{\vec{\text{#1}}} % arrow\)
\( \newcommand{\vectorB}[1]{\overset { \scriptstyle \rightharpoonup} {\mathbf{#1}} } \)
\( \newcommand{\vectorC}[1]{\textbf{#1}} \)
\( \newcommand{\vectorD}[1]{\overrightarrow{#1}} \)
\( \newcommand{\vectorDt}[1]{\overrightarrow{\text{#1}}} \)
\( \newcommand{\vectE}[1]{\overset{-\!-\!\rightharpoonup}{\vphantom{a}\smash{\mathbf {#1}}}} \)
\( \newcommand{\vecs}[1]{\overset { \scriptstyle \rightharpoonup} {\mathbf{#1}} } \)
\(\newcommand{\longvect}{\overrightarrow}\)
\( \newcommand{\vecd}[1]{\overset{-\!-\!\rightharpoonup}{\vphantom{a}\smash {#1}}} \)
\(\newcommand{\ket}[1]{\left| #1 \right>}\)
\(\newcommand{\bra}[1]{\left< #1 \right|}\)
\(\newcommand{\braket}[2]{\left< #1 \vphantom{#2} \right| \left. #2 \vphantom{#1} \right>}\)
\(\newcommand{\braopket}[3]{\left< #1 \vphantom{#2}\vphantom{#3} \right| #2 \vphantom{#1}\vphantom{#3} \left| #3 \vphantom{#1}\vphantom{#2} \right>}\)
\(\newcommand{\qmvec}[1]{\mathbf{\vec{#1}}}\)
\(\newcommand{\op}[1]{\hat{\mathbf{#1}}}\)
\(\newcommand{\expect}[1]{\langle #1 \rangle}\)
\(\newcommand{\dfn}[1]{\emph{\textbf{#1}}}\)
By the end of this chapter, the student should be able to:
- Recognize and understand continuous probability density functions in general (included in this prelude).
- Recognize the normal probability distribution and apply it appropriately.
- Recognize the standard normal probability distribution and apply it appropriately.
- Compare normal probabilities by converting to the standard normal distribution.
- Calculate the probability of a sample average using the cental limit theorem.
- Calculate the probability of a discrete random variable using the normal approximation to the binomial.
Continuous random variables have many applications. Baseball batting averages, IQ scores, the length of time a long distance telephone call lasts, the amount of money a person carries, the length of time a computer chip lasts, and SAT scores are just a few. The field of reliability depends on a variety of continuous random variables.
The values of discrete and continuous random variables can be ambiguous. For example, if \(X\) is equal to the number of miles (to the nearest mile) you drive to work, then \(X\) is a discrete random variable. You count the miles. If \(X\) is the distance you drive to work, then you measure values of \(X\) and \(X\) is a continuous random variable. For a second example, if \(X\) is equal to the number of books in a backpack, then \(X\) is a discrete random variable. If \(X\) is the weight of a book, then \(X\) is a continuous random variable because weights are measured. How the random variable is defined is very important.

Properties of Continuous Probability Distributions
The graph of a continuous probability distribution is a curve. Probability is represented by area under the curve. The curve is called the probability density function (abbreviated as pdf). We use the symbol \(f(x)\) to represent the curve. \(f(x)\) is the function that corresponds to the graph; we use the density function \(f(x)\) to draw the graph of the probability distribution. Area under the curve is given by a different function called the cumulative distribution function(abbreviated as cdf). The cumulative distribution function is used to evaluate probability as area.
- The outcomes are measured, not counted.
- The entire area under the curve and above the x-axis is equal to one.
- Probability is found for intervals of \(x\) values rather than for individual \(x\) values.
- \(P(c < x < d)\) is the probability that the random variable \(X\) is in the interval between the values \(c\) and \(d\). \(P(c < x < d)\) is the area under the curve, above the x-axis, to the right of \(c\) and the left of \(d\).
- \(P(x = c) = 0\) The probability that \(x\) takes on any single individual value is zero. The area below the curve, above the x-axis, and between \(x = c\) and \(x = c\) has no width, and therefore no area (area = 0). Since the probability is equal to the area, the probability is also zero.
- \(P(c < x < d)\) is the same as \(P(c \leq x \leq d)\) because probability is equal to area.
We will find the area that represents probability by using geometry, formulas, technology, or probability tables. In general, calculus is needed to find the area under the curve for many probability density functions. When we use formulas to find the area in this textbook, the formulas were found by using the techniques of integral calculus. However, because most students taking this course have not studied calculus, we will not be using calculus in this textbook. There are many continuous probability distributions. When using a continuous probability distribution to model probability, the distribution used is selected to model and fit the particular situation in the best way.
In this chapter we will study the normal distribution, but there are many types of distributions. The following graphs illustrate these distributions.
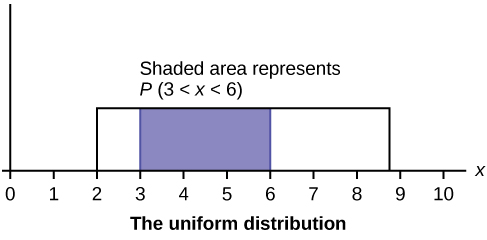
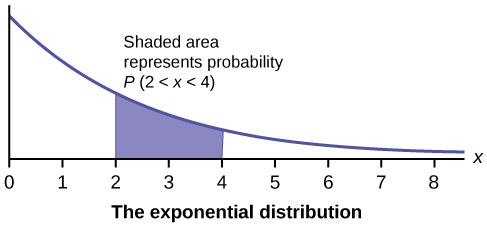
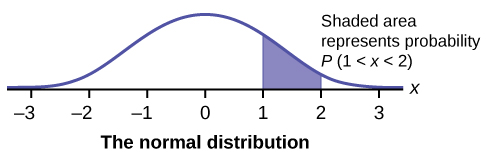
Let's start by examining a uniform distribution since it has as shape you are likely familiar with, a rectangle.
We begin by defining a continuous probability density function. We use the function notation \(f(x)\). Intermediate algebra may have been your first formal introduction to functions. In the study of probability, the functions we study are special. We define the function \(f(x)\) so that the area between it and the x-axis is equal to a probability. Since the maximum probability is one, the maximum area is also one. For continuous probability distributions, PROBABILITY = AREA.
Consider the function \(f(x) = \frac{1}{20}\) for \(0 \leq x \leq 20\). \(x =\) a real number. The graph of \(f(x) = \frac{1}{20}\) is a horizontal line. However, since \(0 \leq x \leq 20\), \(f(x)\) is restricted to the portion between \(x = 0\) and \(x = 20\), inclusive.
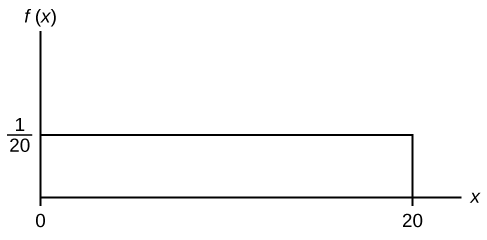
\[f(x) = \frac{1}{20} \text{ for } 0 \leq x \leq 20.\]
The graph of \(f(x) = \frac{1}{20}\) is a horizontal line segment when \(0 \leq x \leq 20\).
The area between \(f(x) = \frac{1}{20}\) where \(0 \leq x \leq 20\) and the x-axis is the area of a rectangle with base = 20 and height = \(\frac{1}{20}\).
\[AREA = 20 \left(\frac{1}{20} \right) = 1\]
Suppose we want to find the area between \(f(x) = \frac{1}{20}\) and the x-axis where \(0 < x < 2\).
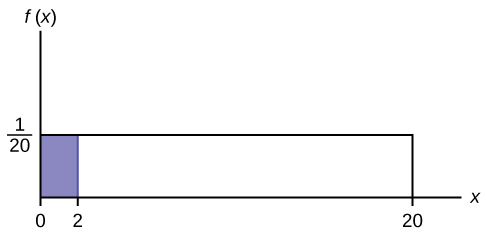
\[AREA = (2 - 0) \left(\dfrac{1}{20} \right) = 0.1\]
\((2 - 0) = 2 = \text{base of a rectangle}\)
REMINDER: area of a rectangle = (base)(height).
The area corresponds to a probability. The probability that x is between zero and two is 0.1, which can be written mathematically as \(P(0 < x < 2) = P(x < 2) = 0.1\).
Suppose we want to find the area between \(f(x) = \frac{1}{20}\) and the x-axis where \(4 < x < 15\).
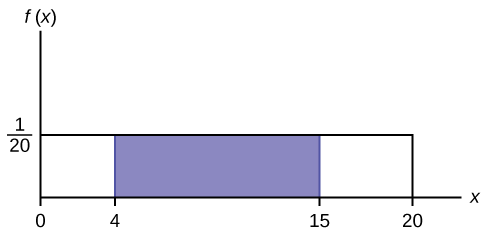
\(\text{AREA} = (15 – 4)(\frac{1}{20}) = 0.55\)
\(\text{AREA} = (15 – 4)(\frac{1}{20}) = 0.55\)
\((15 – 4) = 11 = \text{the base of a rectangle}(15 – 4) = 11 = \text{the base of a rectangle}\)
The area corresponds to the probability \(P(4 < x < 15) = 0.55\).
Suppose we want to find \(P(x = 15)\). On an x-y graph, \(x = 15\) is a vertical line. A vertical line has no width (or zero width). Therefore, \(P(x = 15) = (\text{base})(\text{height}) = (0)\left(\frac{1}{20}\right) = 0\)
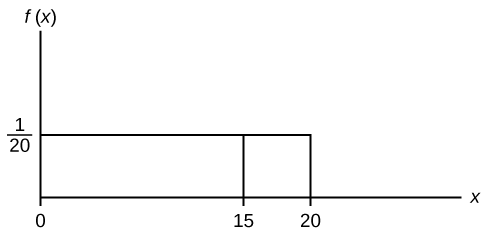
\(P(X \leq x)\) (can be written as \(P(X < x)\) for continuous distributions) is called the cumulative distribution function or CDF. Notice the "less than or equal to" symbol. We can use the CDF to calculate \(P(X > x)\). The CDF gives "area to the left" and \(P(X > x)\) gives "area to the right." We calculate \(P(X > x)\) for continuous distributions as follows: \(P(X > x) = 1 – P(X < x)\).
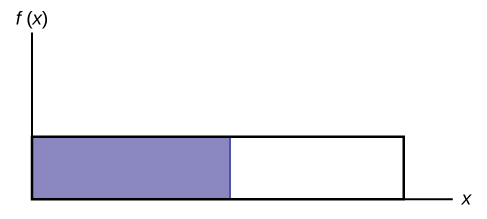
Label the graph with \(f(x)\) and \(x\). Scale the \(x\) and \(y\) axes with the maximum \(x\) and \(y\) values. \(f(x) = \frac{1}{20}\), \(0 \leq x \leq 20\).
To calculate the probability that \(x\) is between two values, look at the following graph. Shade the region between \(x = 2.3\) and \(x = 12.7\). Then calculate the shaded area of a rectangle.
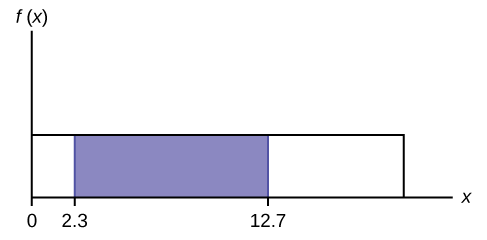
\[P(2.3 < x < 12.7) = (\text{base})(\text{height}) = (12.7−2.3)\left(\dfrac{1}{20}\right) = 0.52\]
Summary
The probability density function (pdf) is used to describe probabilities for continuous random variables. The area under the density curve between two points corresponds to the probability that the variable falls between those two values. In other words, the area under the density curve between points a and b is equal to \(P(a < x < b)\). The cumulative distribution function (cdf) gives the probability as an area. If \(X\) is a continuous random variable, the probability density function (pdf), \(f(x)\), is used to draw the graph of the probability distribution. The total area under the graph of \(f(x)\) is one. The area under the graph of \(f(x)\) and between values a and b gives the probability \(P(a < x < b)\).
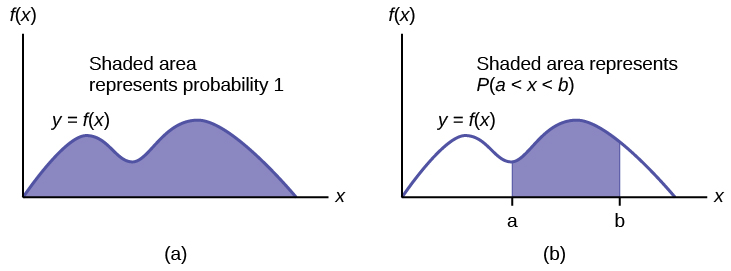
The cumulative distribution function (cdf) of \(X\) is defined by \(P(X \leq x)\). It is a function of \(x\) that gives the probability that the random variable is less than or equal to \(x\).