

11.2: Facts About the Chi-Square Distribution
- Page ID
- 6983

\( \newcommand{\vecs}[1]{\overset { \scriptstyle \rightharpoonup} {\mathbf{#1}} } \)
\( \newcommand{\vecd}[1]{\overset{-\!-\!\rightharpoonup}{\vphantom{a}\smash {#1}}} \)
\( \newcommand{\dsum}{\displaystyle\sum\limits} \)
\( \newcommand{\dint}{\displaystyle\int\limits} \)
\( \newcommand{\dlim}{\displaystyle\lim\limits} \)
\( \newcommand{\id}{\mathrm{id}}\) \( \newcommand{\Span}{\mathrm{span}}\)
( \newcommand{\kernel}{\mathrm{null}\,}\) \( \newcommand{\range}{\mathrm{range}\,}\)
\( \newcommand{\RealPart}{\mathrm{Re}}\) \( \newcommand{\ImaginaryPart}{\mathrm{Im}}\)
\( \newcommand{\Argument}{\mathrm{Arg}}\) \( \newcommand{\norm}[1]{\| #1 \|}\)
\( \newcommand{\inner}[2]{\langle #1, #2 \rangle}\)
\( \newcommand{\Span}{\mathrm{span}}\)
\( \newcommand{\id}{\mathrm{id}}\)
\( \newcommand{\Span}{\mathrm{span}}\)
\( \newcommand{\kernel}{\mathrm{null}\,}\)
\( \newcommand{\range}{\mathrm{range}\,}\)
\( \newcommand{\RealPart}{\mathrm{Re}}\)
\( \newcommand{\ImaginaryPart}{\mathrm{Im}}\)
\( \newcommand{\Argument}{\mathrm{Arg}}\)
\( \newcommand{\norm}[1]{\| #1 \|}\)
\( \newcommand{\inner}[2]{\langle #1, #2 \rangle}\)
\( \newcommand{\Span}{\mathrm{span}}\) \( \newcommand{\AA}{\unicode[.8,0]{x212B}}\)
\( \newcommand{\vectorA}[1]{\vec{#1}} % arrow\)
\( \newcommand{\vectorAt}[1]{\vec{\text{#1}}} % arrow\)
\( \newcommand{\vectorB}[1]{\overset { \scriptstyle \rightharpoonup} {\mathbf{#1}} } \)
\( \newcommand{\vectorC}[1]{\textbf{#1}} \)
\( \newcommand{\vectorD}[1]{\overrightarrow{#1}} \)
\( \newcommand{\vectorDt}[1]{\overrightarrow{\text{#1}}} \)
\( \newcommand{\vectE}[1]{\overset{-\!-\!\rightharpoonup}{\vphantom{a}\smash{\mathbf {#1}}}} \)
\( \newcommand{\vecs}[1]{\overset { \scriptstyle \rightharpoonup} {\mathbf{#1}} } \)
\(\newcommand{\longvect}{\overrightarrow}\)
\( \newcommand{\vecd}[1]{\overset{-\!-\!\rightharpoonup}{\vphantom{a}\smash {#1}}} \)
\(\newcommand{\ket}[1]{\left| #1 \right>}\)
\(\newcommand{\bra}[1]{\left< #1 \right|}\)
\(\newcommand{\braket}[2]{\left< #1 \vphantom{#2} \right| \left. #2 \vphantom{#1} \right>}\)
\(\newcommand{\braopket}[3]{\left< #1 \vphantom{#2}\vphantom{#3} \right| #2 \vphantom{#1}\vphantom{#3} \left| #3 \vphantom{#1}\vphantom{#2} \right>}\)
\(\newcommand{\qmvec}[1]{\mathbf{\vec{#1}}}\)
\(\newcommand{\op}[1]{\hat{\mathbf{#1}}}\)
\(\newcommand{\expect}[1]{\langle #1 \rangle}\)
\(\newcommand{\dfn}[1]{\emph{\textbf{#1}}}\)
The notation for the chi-square distribution is:
\[\chi \sim \chi^{2}_{df}\]
where \(df =\) degrees of freedom which depends on how chi-square is being used. (If you want to practice calculating chi-square probabilities then use \(df = n - 1\). The degrees of freedom for the three major uses are each calculated differently.)
For the \(\chi^{2}\) distribution, the population mean is \(\mu = df\) and the population standard deviation is
\[\sigma = \sqrt{2(df)}.\]
The random variable is shown as \(\chi^{2}\), but may be any upper case letter. The random variable for a chi-square distribution with \(k\) degrees of freedom is the sum of \(k\) independent, squared standard normal variables.
\[\chi^{2} = (Z_{1})^{2} + ... + (Z_{k})^{2}\]
- The curve is nonsymmetrical and skewed to the right.
- There is a different chi-square curve for each \(df\).
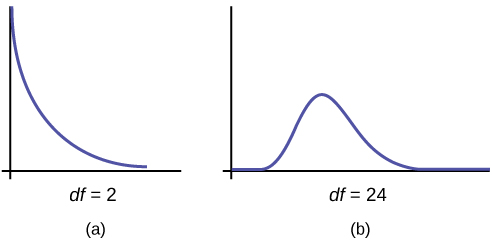
Figure \(\PageIndex{1}\)
- The test statistic for any test is always greater than or equal to zero.
- When \(df > 90\), the chi-square curve approximates the normal distribution. For \(\chi \sim \chi^{2}_{1,000}\) the mean, \(\mu = df = 1,000\) and the standard deviation, \(\mu = \sqrt{2(1,000)}\). Therefore, \(X \sim N(1,000, 44.7)\), approximately.
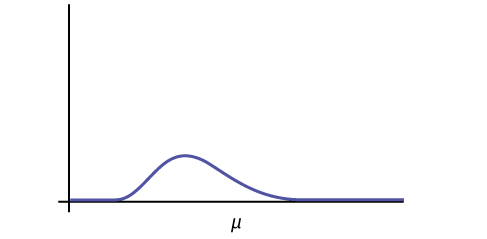
- The mean, \(\mu\), is located just to the right of the peak.
References
- Data from Parade Magazine.
- “HIV/AIDS Epidemiology Santa Clara County.”Santa Clara County Public Health Department, May 2011.
Chapter Review
The chi-square distribution is a useful tool for assessment in a series of problem categories. These problem categories include primarily (i) whether a data set fits a particular distribution, (ii) whether the distributions of two populations are the same, (iii) whether two events might be independent, and (iv) whether there is a different variability than expected within a population.
An important parameter in a chi-square distribution is the degrees of freedom \(df\) in a given problem. The random variable in the chi-square distribution is the sum of squares of df standard normal variables, which must be independent. The key characteristics of the chi-square distribution also depend directly on the degrees of freedom.
The chi-square distribution curve is skewed to the right, and its shape depends on the degrees of freedom \(df\). For \(df > 90\), the curve approximates the normal distribution. Test statistics based on the chi-square distribution are always greater than or equal to zero. Such application tests are almost always right-tailed tests.
Formula Review
\[\chi^{2} = (Z_{1})^{2} + (Z_{2})^{2} + ... + (Z_{df})^{2}\] chi-square distribution random variable
\(\mu_{\chi^{2}} = df\) chi-square distribution population mean
\(\sigma_{\chi^{2}} = \sqrt{2(df)}\) Chi-Square distribution population standard deviation
Exercise 11.2.1
If the number of degrees of freedom for a chi-square distribution is 25, what is the population mean and standard deviation?
Answer
mean \(= 25\) and standard deviation \(= 7.0711\)
Exercise 11.2.2
If \(df > 90\), the distribution is _____________. If \(df = 15\), the distribution is ________________.
Exercise 11.2.3
When does the chi-square curve approximate a normal distribution?
Answer
when the number of degrees of freedom is greater than 90
Exercise 11.2.4
Where is \(\mu\) located on a chi-square curve?
Exercise
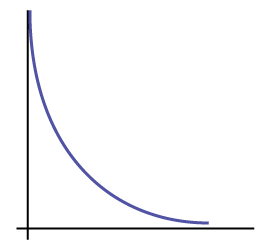
Is it more likely the df is 90, 20, or two in the graph?
Answer
\(df = 2\)