
Ch 2.1 Stemplots and Dotplots
- Page ID
- 15880
Ch 2.1 Stemplots and Dotplots
To summarize quantitative data: we look at five areas:
CVDOT: center, variation, distribution, outlier, trend.
Summarize quantitative data by graph:
- Stemplot
- Dotplot
- Histogram (main one)
- Boxplot.
A) Stemplot
Stemplot is a quick way to graph relatively small quantitative data. It can show the overall pattern and outliers. The main problem is data value must be in a relatively small range. But data values can be recovered from a stemplot. Also, stemplot can easily be created without use of technology.
Each data value is separated into stem and leaf (the last digit). Data are arranged in order with the same stem in a row. Back-to-back stem plot can be used to compare two datasets. It can be used to show distribution of data (look side way).
Note: do not skip a stem with no leave to show distribution and outliers correctly.
Online stemplot maker:
http://digitalfirst.bfwpub.com/stats_applet/stats_applet_8_ovc.html
If data consists of decimal, use this online stemplot maker: https://www.geogebra.org/m/zPA7QFe
Ex1. A stemplot is given below: legend 6|3 means 63

a) How many data are there? ____ 2 + 2 + 5 + 2 = 11
b) What is the lowest and highest data?_______ lowest value is 63, highest is 99
c) What is the list of data? _____The whole list of data can be recovered as 63, 65, 78, 79, 81, 82, 82, 85, 89, 91, 99.
Ex2. Graph stemplots for the two different samples of grades. Describe shape of distribution.
Sample 1: 63, 65, 68, 69, 81, 82, 82, 85, 89, 91, 99
Sample 2: 63, 65, 68, 69, 81, 82, 82, 85, 89, 91, 99, 123
Use online stemplot calculator
Sample 1
 The shape is not very clear because there is only 3 bars.
There is a gap between two peaks.
sample 2
Th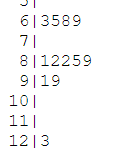 e shape is not very clear because there are only 4 bars.
There is a gap between 60 and 80. There is an outlier at 123.
B) Dotplot
Doplots are used for graphing small discrete dataset with small range. It is possible to recreate the original list of data values. Also, Dotplots can be easily created without the use of technology.
Online dotplot maker:
https://www.geogebra.org/m/BxqJ4Vag
(enter data to column A only)
Ex1.
Sketch a dotplot for : 3, 4, 5, 7, 8, 9, 5, 6, 7, 7, 7, 7.
Describe shape of distribution and outliers.
Answer:
Use Geogebra dotplot calculator:
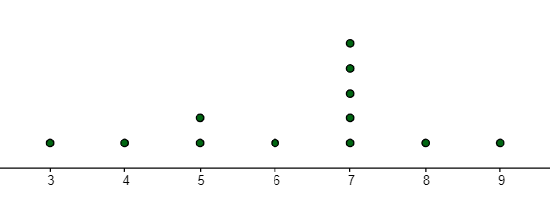
The shape is left-skewed. There are no outliers.