
Ch 12.5 Prediction
- Page ID
- 15929
Ch 12.5 Prediction
Criteria for using the line of best fit to predict y:
1) Scatte plot indicates a linear pattern with no other non-linear patterns or outliers.
2) (x, y) are matched-pair and linearly correlated. Scatter plot does not show non-linear patterns.
3) x is within the prediction domain for intrapolation. The range of x values in the sample is the appropriate domain.
4) For each fixed value of x, the corresponding values of y have a normal distribution. (loose requirement)
Find best prediction for y.
Step1: Find the Linear regression equation, p-value and r and the scatter plot.
Enter matched pair data to statdisk columns. Use Analysis/Correlation and Regression/ Enter significance, select data columns.
Output: r, critical r, p-value, b0 and b1, r2 and scatter plot. \( \hat{y} = b_0 + b_1 x \) is the regression line.
Step 2: check scatter plot linear pattern and inspect if there is any non-linear pattern or outliers.
Step 3: Determine if (x, y) are linear related.
If p-value ≤ α , reject H0, conclude x, y are linear correlated
If p-value > α, conclude x, y are not linear correlated. OR
If r outside the range of -critical r and +critical r, conclude x, y are linear correlated.
Step 4: Find the best predicted y.
If x,y are linear correlated, use the linear regression equation to find the best predicted y, ![]() .
.
\( \hat{y} = b_0 + b_1 x \)
If x, y are not linear correlated, use \( \bar{y} \)![]() (mean of y) as best predicted y.
(mean of y) as best predicted y.
To find \( \bar{y} \), use Statdisk/ Explore Data/ to find mean of y.
How good is the prediction
The correlation of determination, r2 descibes how good the linear regression is in predicating the variation of y. The higher the correlation of determination, the better is the prediction.
Ex 1:
Given the following matched pair data:
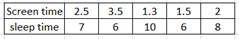
Use the information to find the best predicted value of sleep time if the screen time is 3 hours. Use α=0.05
1) Find regression line equation, p-value,r, scatter plot.
Enter data to 2 columns of statdisk. Use Analysis/Correlation and Regression/ Enter significance, select data columns.
Output: r = -0.579, critical r = ±0.878, p-value=0.3061, b0= 9.774, b1=-1.099, scatter plot in other tab.
Linear regression equation is \( \hat{y} = 9.774 + 1.099 x \)
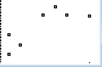
2) Check Scatter plot
 There is no systematic non-linear pattern. There seems to be a negative weak correlation.
3) Determine if x, y are linear correlated.
since r = -0.579 is between -0.878 and +0.878, conclude no linear correlation.
OR : since p-value (0.306) > 0.05, conclude no linear correlation.
4) Since x, y are not linearly correlated, the best predicted value is mean of y. \( \bar{y} \)
Statdisk/Data/Explore data/select sleep time column, mean = 7.4. So best predicted y when x = 3 hour is 7.4 hours
Ex 3. Given matched pair data for 7 students’ study hour and final exam scores.
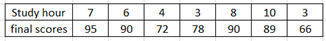
Use α= 0.05 to predict a student’s final score based on study hour of 6 hours.
Step 1) Find linear regression equation, p-value ,r and scatter plot.
Enter study hour and final scores to statdisk.
Analysis/Correlation and Regression/enter significance = 0.05, select data columns.
Output: r = 0.789, critical r = ±0.754, p-value = 0.0351, b0 =64.017, b1 = 3.217.
So \( \hat{y} = 64.017 + 3.217 x \) is the linear regression line.
Step 2) Check scatter plot:
 Check scatter plot tab.
There is no non-linear patterns or outliers. The correlation is not very strong.
Step 3) Determine if x and y are linearly correlated.
Since p-value < 0.05 reject H0, conclude x and y are linearly correlated. OR r = 0.789 is outside the range of -0.754 and +0.754, so there is linear correlation.
4) Since x, y are linearly correlated, use linear regression line to find best prediction of score when x = 6 hours.
\( \hat{y} = 64.017 + 3.217 * 6 \). Best predicted scores = 83.3
b) Can the line of best fit equation be used to find predicted scores when study hour is 0. Explain.
Since 0 is not within the prediction domain, the regression line should not be used for prediction.
Ex4:
Given x, y are matched pair data with no non-linear pattern in scatter plot with ![]() =3.3 and
=3.3 and ![]()
The line of best fit is \( \hat{y} = 2.1 + 0.32 x \) .
Correlation r = 0.82, and critical r= 0.754, find the best predicted y when x is 2.5 at α= 0.05.
Since r = 0.82 > 0.754 so x, y are linear correlated.
The best predicted y is from the linear regression line = 2.1+ 0.32(2.5) =2.9.
Ex5:
Given x, y are matched pair data with no non-linear pattern in scatter plot with \( \bar{x}=6.5 \) and \( \bar{y} = 1.9 \).
The line of best fit is \( \hat{y} = 2.1 + 0.32 x \).
Given correlation p-value = 0.11, find the best predicted y when x is 5 at α= 0.05.
Since p-value 0.11 > 0.05 so x, y are not linear correlated.
The best predicted y is the mean of y = 1.9 instead of using the linear regression line.