
Ch 7.1 Central Limit Theorem for Sample Means
- Page ID
- 15911
Ch 7.1 Central Limit Theorem for Sample Means
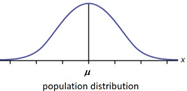
Sample distribution of sample mean:
When sample means \( \bar{x} \) of same size n taken from the same population, the Sample means have the following behavior:
1) If the population distribution of X is normal, the distribution of \( \bar{x} \) is always normal for all sample size n.
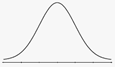
Sampling distribution of x-bar
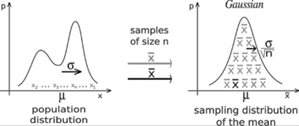
2) When population distribution of X is not normal, The sampling distribution x-bar tends to be a normal distribution. The distribution become closer to normal when sample size increase.
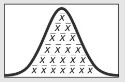
Activity to discover the Central Limit Theorem:
Central Limit Theorem for Sample Mean:
For all sample of the same size n with n > 30, the sampling distribution of \( \bar{x} \) can be approximated by a normal distribution with mean μ and standard deviation \( \sigma _{\bar{x}} = \frac{\sigma}{\sqrt{n}} \)
Note: -This applies to all distribution of x. If X is normally distributed, n > 30 is not needed. Any n will work.
![]() -The sample should be a Simple Random Sample.
-The sample should be a Simple Random Sample.
Central Limit Theorem: \( \mu _{\bar{x}} = \mu \),
\( \sigma _{\bar{x}} = \frac{\sigma}{\sqrt{n} \)}
Ex1 A standardized test with scores that are normally distributed with mean μ = 150 and standard deviation σ = 18. A class of 20 students take the test. The mean score \( \bar{x} \) of the 20 students are calculated.
a) Is the distribution of mean score \( \bar{x} \) of 20 students Normally distributed?
Ans: Yes because the original score is Normal.
a) What is the mean and standard deviation of ?
Use Central Limit Theorem: mean = 150, SD = \( \frac{18}{\sqrt{20}} \) ≈ 4.0249
b) Find the probability that a student’s score is greater than 160.
 Use Online Normal Calculator, Mean = 150, SD = 4.0249
c) Find the probability that the mean score \( \bar{x} \) of 20 students is greater than 160.
Click above, enter 160. Recalculate. P( \( \bar{x} \) > 160) = 0.0065
Ex2: Coke cans are filled so that the actual amounts have a mean of 12 oz and a standard deviation of 0.11 oz. The distribution of amount of coke is unknown.
a) Is the distribution of mean amount of coke in 36 cans normally distributed?
Yes, because n > 30, according to CLT, \( \bar{x} \) will be normally distributed.
b) What is the mean and standard deviation of \( \bar{x} \)?
Ans: according to CLT: \( \mu_ \bar{x} \) = 12, \(\sigma _{\bar{x}} \) = 0.11/√36 ≈ 0.01833
c) Find the percent of individual coke with amount between 11.9 to 12.1 oz.
Use online Normal Calculator: Mean = 12, SD = 0.11
Click between, enter 11.9 and 12.1, Recalculate. P( 11.9 < x < 12.1 ) = 0.6367
63.67% of coke have amount between 11.9 oz to 12.1 oz.
d) Find the percent of mean amount of 36 coke with between 11.9 and 12.1 oz.
Use online Normal Calculator: Mean = 12, SD = 0.01833,
Click between, enter 11.9 and 12.1, Recalculate. P( 11.9 < \( \bar{x} \) < 12.1 ) = 1
100% of mean amount of 36 coke is between 11.9 and 12.1 oz.
Ex3. Annual incomes are known to have a distribution that is skewed to the right. Assume that 20
workers’ mean incomes \( \bar{x} \) are collected.
a) Will the distribution of mean income \( \bar{x} \) be normally distributed?
Ans: No, since X is not normal and n < 30, CLT does not apply, \( \bar{x} \) may not be normally distributed.