Ch 1.3 Frequency Distribution (GFDT)
- Page ID
- 15875
Ch 1.3 Grouped Frequency Distribution Table (GFDT)
Quantitative data can be summarized into a frequency table by classifying data into classes. Class can have a range of non-overlapping value with equal class width (difference between class lower class limits)
Terms related to GFDT:
lower limits: lower bound of each class .
upper limits: upper bound of each class.
class midpoints: \( \dfrac{(lower + upper)}{2} \)
class width: difference between 2 consecutive lower limits.
class boundaries: values between 2 classes.
Ex.Given GFDT below: find lower limits, classwidth, class midpoints.
Because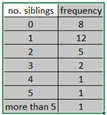 each class has one value, lower limits and upper limits are the same: 0, 1, 2, 3, 4, 5.
classwidth = 1
class midpoints: 0, 1, 2, 3, 4, 5
lower class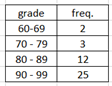 limits: 60, 70, 80, 90
upper class limits: 69, 79, 89, 99
classwidth = 10
class midpoints: 64.5, 74.5, 84.5, 94.5
Relative and Cumulative frequency Distribution Table
Relative frequency and cumulative frequency can be evaluated for the classes. Because of rounding the relative frequency may not be sum to 1 but should be close to one.
Rounding review:
If the number place you are rounding is followed by 5, 6, 7, 8, or 9, round the number up.
If the number place you are rounding is followed by 0, 1, 2, 3, or 4, round the number down.
Ex1. Round to three decimal places:
a) 0.1278, b) 0.1283, c) 0.1239, d) 0.1298 e) 5/6
Ans: 0.1278 round to 0.128, 0.1283 round to 0.128, 0.1239 round to 0.124, 5/6 round to 0.833
Ex2. Round to 1 decimal place of a percent.
a) 0.1184 b) 45.677% c) 52/89
0.1184 is 11.84% round to 11.8%, 45.677% round to 45.7%, 52/89 round to 58.4%
Ex3. Round to the nearest whole number.
a) 12% of 781 b) 15.2% of 2344
a) 0.12 (781) =93.72 round to 94 b) 0.152(2344) =356.288 round to 356
Relative frequency for a class = \(\dfrac{\text{frequency for the class}}{\text {sum of all frequency}}\)
cumulative frequency =sum of the frequencies for that class and all previous classes
Ex1. Find relative and cumulative frequency for service time for a fast food restaurant given in the following GFDT.
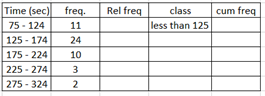 total frequency = 50,
Relative frequencies: 11/50 = 0.22, 24/50 = 0.48, 10/50 = 0.2, 3/50 = 0.06, 2/50 = 0.02
class: less than 125, less than 175, less than 225, less than 275, less than 325
Cumulative frequencies: 11, 35, 45, 48, 50
Classes with overlapping class limits:
When frequency table has classes with overlapping limits at the end points, the common convention is
lower limit ≤ data < upper limit. or the classes are assigned so all data values fall between the limits.
Ex2. Find the percent of town with rainfall less than 9.01 in.
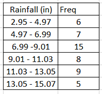 Total frequencies = 6 + 7+ 15 + 8 + 9 + 5 = 50
The first three classes has rainfall less than 9.01: (6 + 7 + 15)/50 = 0.56 = 56%
Frequency table where the class is time such as years.
Ex3. Find percent of crashes occurs after 2015.
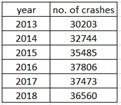
Total frequencies = 30203 + 32744 + 35485 + 37809 + 37473 + 36560 = 210271
number of crashes after 2015 are at year 2016 to 2018 : 37806+37473+36560 = 111839
Percent = 111839/210271 = 53.2%
Graph a GFDT from data using online "socialscience calculator":
https://www.socscistatistics.com/descriptive/frequencydistribution/default.aspx
- -Find the minimum data value.
- - Enter data in a column in the input frame.
- - Click Generate.
- - select number of classes and the lowest class limits that should include the minimum data value and a nice value.
- - Click Edit frequency table for the new table.
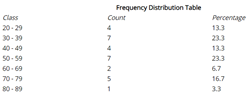
Ex1. Construct a GFDT from the data below: use 7 classes and start with a “nice” good lowest limit.
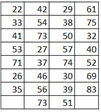 Use socialscience calculator,
Input data to input frame. Click generate, then change class size to 7 and lowest class value to 20. Then click Edit frequency table.