
Ch 7.2 Central Limit Theorem for Sample Total
- Page ID
- 15913
Ch 7.2 Central Limit Theorem for Sample sum
For all sample of the same size n with n > 30, the sampling distribution of \( \sum{x} \) can be approximated by a normal distribution
with mean = \( (n) \mu \) and standard deviation = \( \sigma * \sqrt{n} \)
Central Limit Theorem for Sample Sum: \( \mu _{sum} = n\mu ; \sigma _{sum} = \sigma *\sqrt{n} \)
-This applies to all distribution of x. If X is normally distributed, n > 30 is not needed. Any n will work.
-The sample should be a Simple Random Sample.
Ex1. An unknown distribution has a mean of 45 and a standard deviation of 8. A sample size of 50 is drawn randomly from the population. .
a) Can Central Limit for Sum be used to model the distribution of the sum of 50 sample? Explain.
Yes, because sample size 50 > 30.
b) Find the probability that the sum of the 50 values is more than 2400.
Use Central limit for sum: \( \mu _{sum} = 45*50 = 2250; \sigma _{sum} = 8 *\sqrt{50} = 56.5685\)
Use Onlline Normal Calculator: mean = 2250, SD = 56.5685, Select above, enter 2400, recalculate
P( \( \sum{x}} \) > 2400) = 0.004
Ex2: An elevator has a maximum weight limit of 5000 lb or 27 passengers. Assume adult males have weights that are normally distributed with a mean of 189 lb. and a standard deviation of 39 lb.
a) Can the sum of 27 passengers’ weight be modeled by Normal distribution? If yes, what is the mean and standard deviation of sum of weight of 27 passengers?
Yes, because the population distribution of adult male are given as normally distributed.
According to CLT, mean = 189* 27 = 5103, SD = \( 39*\sqrt{27} \) = 202.6499
b) Does this elevator appear to be safe? Find the probability that the total weight of 27 passengers exceed the maximum weight limit.
Use online Normal Calculator, mean = 5103, SD = 202.6499, Click above, enter 5000, recalculate
P (sum of 27 > 5000) = 0.6944 > 0.05
The sum of 27 male adults has a 69.44% chance of over the weight limit of 5000lb. This event is not unlikely, so the elevator is not safe.
Ex3. The passenger load for a water-taxi is 3500 lb. Assume weights of passenger are normally distributed with mean 174 lb. with a standard deviation of 21 lb. Is it safe have a passenger limit of up to 20?
a) Can the sum weight of 20 passengers be modeled by Central limit Theorem of sum? If yes, what is the mean and standard deviation of the weights?
Yes, because the population distribution of adult male are given as normally distributed.
According to CLT, mean = 174* 20 =3480, SD = \( 21*\sqrt{20} \) = 93.9149
b) Determine the probability that 20 passenger’s total weight will exceed the passenger load of 3500 lb. Is the 20-passenger limit safe?
Use online Normal Calculator, mean = 3480, SD = 93.9149, Click above, enter 3500. Recalculate
P (sum of 20 > 3500) = 0.4157 > 0.05
The sum of 20 passengers has a 41.57% chance of exceeding 3500 lb. This event is not unlikely, so the passenger limit is not safe.
Normality assessment:
The following procedure can be used to determine if sample data are from a population having a Normal distribution.
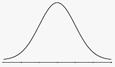
1) Histogram: If the histogram departs dramatically from a bell shape, conclude data do not come from a normal distribution.
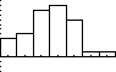 If Histogram from the sample does not departs from a bell shape distribution, conclude the Population may be Normal.
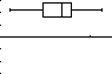 2) Outliers: If there is more than one outlier, conclude data do not come from a normal distribution.
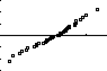 3) Normal Quantile plot: If patterns of the points is reasonably close to a straight line and the points does not show some systematic pattern that is not a straight line pattern, conclude Normal distribution
Normal quantile plot (or Normal probability plot) is a plot of (x, y) where x is the original data and y is the corresponding z-score that is expected from a normal distribution.
Steps:
1) input data to Sample editor in Statdisk.
2) Data/Normality Assessment/
3) Check that number of outliers are at most 1. Check that Histogram has a approximately bell shape distribution. Check that points on Normal Quantile plot are reasonably close to a straight line.
Ex1. Sample question: Do the following values come from a population with normal distribution?
7.19, 6.31, 5.89, 4.5, 3.77, 4.25, 5.19, 5.79, 6.79.
Input data to statdisk, data/Noramality Assessment/
-number of outliers is 0
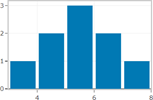 Histogram shows relatively symmetrical
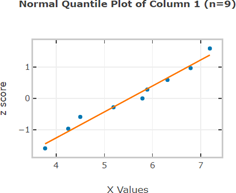 -Normal quantile plot shows plot along a linear pattern.
Final conclusion: the sample are from a population that is Normal.