1.3.5.1: Stem and Leaf Plots
- Page ID
- 28661
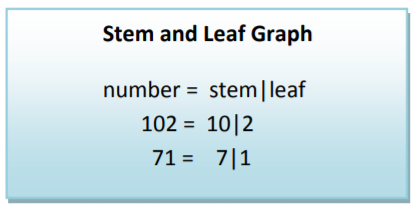
A stem and leaf plot is a method of tabulating the data to make it easy to interpret. Each data value is split into a "stem" (the first digit or digits) and a "leaf" (the last digit, usually). For example, the stem for 102 minutes would be 10 and the leaf would be 2.
The stems are then written on the left side of the graph and all corresponding leaves are written to the right of each matching stem.

The stem and leaf plot allows us to do some preliminary analysis of the data. The center is around 100 minutes. The spread between the highest and lowest numbers is 58 minutes. The shape is not symmetric since the data is more spread out towards the lower numbers. In statistics, this is called skewness and we would call this data negatively skewed.
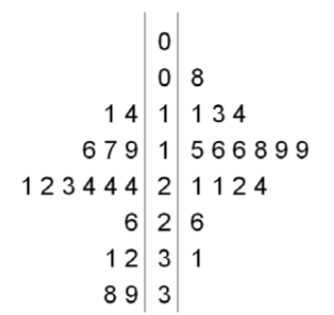
Stem and leaf plots can also be used to compare similar data from two groups in a back‐to‐back format.
In a back‐to‐back stem and leaf plot, each group would share a common stem and leaves would be written for each group to the left and right of the stem.
Example: Comparing two airlines’ passenger loading times
The data shown represents the passenger boarding time (in minutes) for a sample of 16 airplanes each for two different airlines.

Airline A will be represented on the left side of the stem, while Airline B will be represented on the right. Instead of using the last digit as the leaf (each row representing 10 minutes), we are instead going to let each row represent 5 minutes. This will allow us to better see the shape of the data.
The center for Airline B is about 5 minutes lower than Airline A. The spread for each airline is about the same. Airline A shape seems slightly skewed towards positive values (skewed positive) while Airline B times are somewhat symmetric.