Statistics LibreTexts

15.4: Flash Animations

  • Page ID
    20866
  • \( \newcommand{\vecs}[1]{\overset { \scriptstyle \rightharpoonup} {\mathbf{#1}} } \) \( \newcommand{\vecd}[1]{\overset{-\!-\!\rightharpoonup}{\vphantom{a}\smash {#1}}} \)\(\newcommand{\id}{\mathrm{id}}\) \( \newcommand{\Span}{\mathrm{span}}\) \( \newcommand{\kernel}{\mathrm{null}\,}\) \( \newcommand{\range}{\mathrm{range}\,}\) \( \newcommand{\RealPart}{\mathrm{Re}}\) \( \newcommand{\ImaginaryPart}{\mathrm{Im}}\) \( \newcommand{\Argument}{\mathrm{Arg}}\) \( \newcommand{\norm}[1]{\| #1 \|}\) \( \newcommand{\inner}[2]{\langle #1, #2 \rangle}\) \( \newcommand{\Span}{\mathrm{span}}\) \(\newcommand{\id}{\mathrm{id}}\) \( \newcommand{\Span}{\mathrm{span}}\) \( \newcommand{\kernel}{\mathrm{null}\,}\) \( \newcommand{\range}{\mathrm{range}\,}\) \( \newcommand{\RealPart}{\mathrm{Re}}\) \( \newcommand{\ImaginaryPart}{\mathrm{Im}}\) \( \newcommand{\Argument}{\mathrm{Arg}}\) \( \newcommand{\norm}[1]{\| #1 \|}\) \( \newcommand{\inner}[2]{\langle #1, #2 \rangle}\) \( \newcommand{\Span}{\mathrm{span}}\)\(\newcommand{\AA}{\unicode[.8,0]{x212B}}\)

    I have designed four interactive Flash animations that will provide students with deeper insight of the major concepts of inference and hypothesis testing. These animations are on the website http://nebula2.deanza.edu/~mo/  .

    Central Limit Theorem (Chapter 8)

    clipboard_e05f402da794fc3e4022d57009728ff83.png

    Using die rolling with progressively increasing sample sizes, this animation shows the three main properties of the Central Limit Theorem.

    Inference Process (Chapter 9)

    clipboard_e67000dff33286726fd72975a2898081d.png

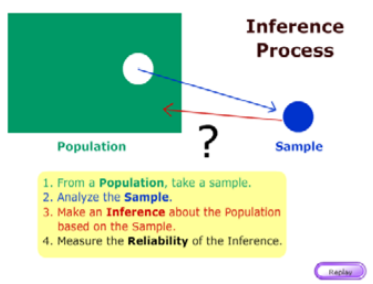
    This animation walks a student through the logic of the statistical inference and is presented just before confidence intervals and hypothesis testing.

    Confidence Intervals (Chapter 9)

    clipboard_e139af1af4f952fc13f1521687c812daa.png

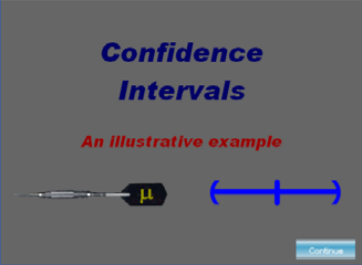
    This animation compares hypothesis testing to an unusual method of playing darts and compares it to a practical example from the 2008 presidential election.

    Statistical Power in Hypothesis Testing (Chapter 10)

    clipboard_ec4f5f72426e9c1d7c60a0e168ddc365d.png

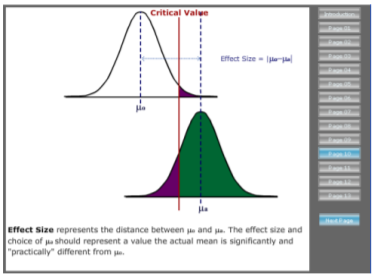
    This animation explains power, Type I and Type II error conceptually, and demonstrates the effect of changing model assumptions.


    This page titled 15.4: Flash Animations is shared under a CC BY-SA 4.0 license and was authored, remixed, and/or curated by Maurice A. Geraghty via source content that was edited to the style and standards of the LibreTexts platform; a detailed edit history is available upon request.