
15.3.3: Chapter 4 Lab
- Page ID
- 28617

\( \newcommand{\vecs}[1]{\overset { \scriptstyle \rightharpoonup} {\mathbf{#1}} } \) \( \newcommand{\vecd}[1]{\overset{-\!-\!\rightharpoonup}{\vphantom{a}\smash {#1}}} \)\(\newcommand{\id}{\mathrm{id}}\) \( \newcommand{\Span}{\mathrm{span}}\) \( \newcommand{\kernel}{\mathrm{null}\,}\) \( \newcommand{\range}{\mathrm{range}\,}\) \( \newcommand{\RealPart}{\mathrm{Re}}\) \( \newcommand{\ImaginaryPart}{\mathrm{Im}}\) \( \newcommand{\Argument}{\mathrm{Arg}}\) \( \newcommand{\norm}[1]{\| #1 \|}\) \( \newcommand{\inner}[2]{\langle #1, #2 \rangle}\) \( \newcommand{\Span}{\mathrm{span}}\) \(\newcommand{\id}{\mathrm{id}}\) \( \newcommand{\Span}{\mathrm{span}}\) \( \newcommand{\kernel}{\mathrm{null}\,}\) \( \newcommand{\range}{\mathrm{range}\,}\) \( \newcommand{\RealPart}{\mathrm{Re}}\) \( \newcommand{\ImaginaryPart}{\mathrm{Im}}\) \( \newcommand{\Argument}{\mathrm{Arg}}\) \( \newcommand{\norm}[1]{\| #1 \|}\) \( \newcommand{\inner}[2]{\langle #1, #2 \rangle}\) \( \newcommand{\Span}{\mathrm{span}}\)\(\newcommand{\AA}{\unicode[.8,0]{x212B}}\)
Experimental Design
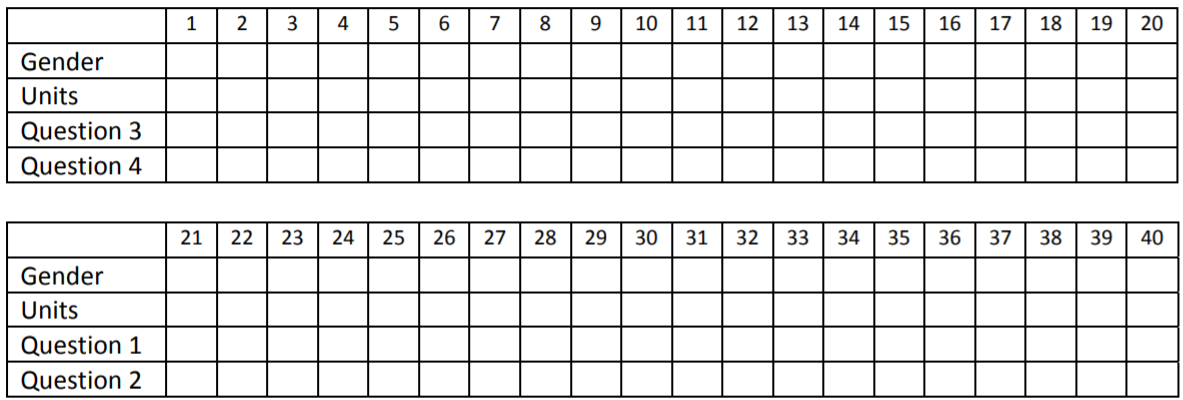
- Design a survey. You are going to ask other students in the class four questions, 2 of which you will create:
What is your gender (Male, Female, Other Answer)?
How many units are you currently taking?
Question 3 ________________________________________________________________________
Responses to Question 3 _____________________________________________________________
Question 4 ________________________________________________________________________
Responses to Question 4 _____________________________________________________________
- Collect Data from Students in class ‐ ask as many students as possible the 4 questions. Put the responses here.
- Is this an observational study or an experiment? Explain?
- What type of sampling method did you use?
- Now, enter the data in the Minitab worksheet lab03.mpj. There will be 4 columns: Gender, Units, Question3, Question4.
- Create a graph that shows the percentage of each gender in your sample.
- Create a graph that shows the distribution of Units.
- Create a graph that shows the distribution of Question 3.
- Create a graph that shows the distribution of Question 4.
- Create a graph that shows the distribution of Question 3 by Gender.
- Create a graph that shows the distribution of Question 4 by Units.
- Write a paragraph describing the graphs, pointing out anything you found of interest.