
15.2.11: Chapter 12 Homework
- Page ID
- 28314

\( \newcommand{\vecs}[1]{\overset { \scriptstyle \rightharpoonup} {\mathbf{#1}} } \) \( \newcommand{\vecd}[1]{\overset{-\!-\!\rightharpoonup}{\vphantom{a}\smash {#1}}} \)\(\newcommand{\id}{\mathrm{id}}\) \( \newcommand{\Span}{\mathrm{span}}\) \( \newcommand{\kernel}{\mathrm{null}\,}\) \( \newcommand{\range}{\mathrm{range}\,}\) \( \newcommand{\RealPart}{\mathrm{Re}}\) \( \newcommand{\ImaginaryPart}{\mathrm{Im}}\) \( \newcommand{\Argument}{\mathrm{Arg}}\) \( \newcommand{\norm}[1]{\| #1 \|}\) \( \newcommand{\inner}[2]{\langle #1, #2 \rangle}\) \( \newcommand{\Span}{\mathrm{span}}\) \(\newcommand{\id}{\mathrm{id}}\) \( \newcommand{\Span}{\mathrm{span}}\) \( \newcommand{\kernel}{\mathrm{null}\,}\) \( \newcommand{\range}{\mathrm{range}\,}\) \( \newcommand{\RealPart}{\mathrm{Re}}\) \( \newcommand{\ImaginaryPart}{\mathrm{Im}}\) \( \newcommand{\Argument}{\mathrm{Arg}}\) \( \newcommand{\norm}[1]{\| #1 \|}\) \( \newcommand{\inner}[2]{\langle #1, #2 \rangle}\) \( \newcommand{\Span}{\mathrm{span}}\)\(\newcommand{\AA}{\unicode[.8,0]{x212B}}\)
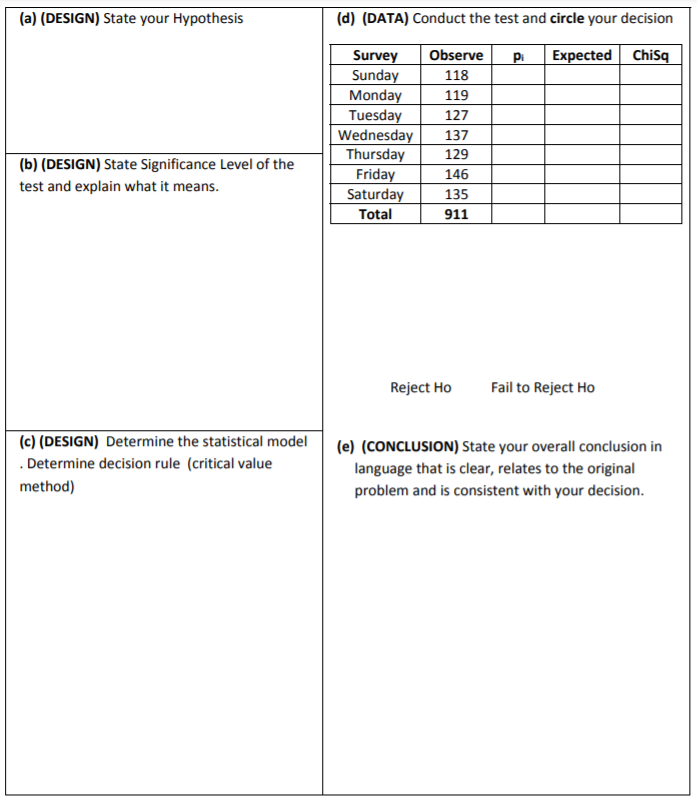
- A bicycle safety organization claims that fatal bicycle accidents are uniformly distributed throughout the week. The table shows the day of the week for which 911 randomly selected fatal bicycle accidents occurred. At \(\alpha = 0.10\), can you reject the claim that the distribution is uniform?
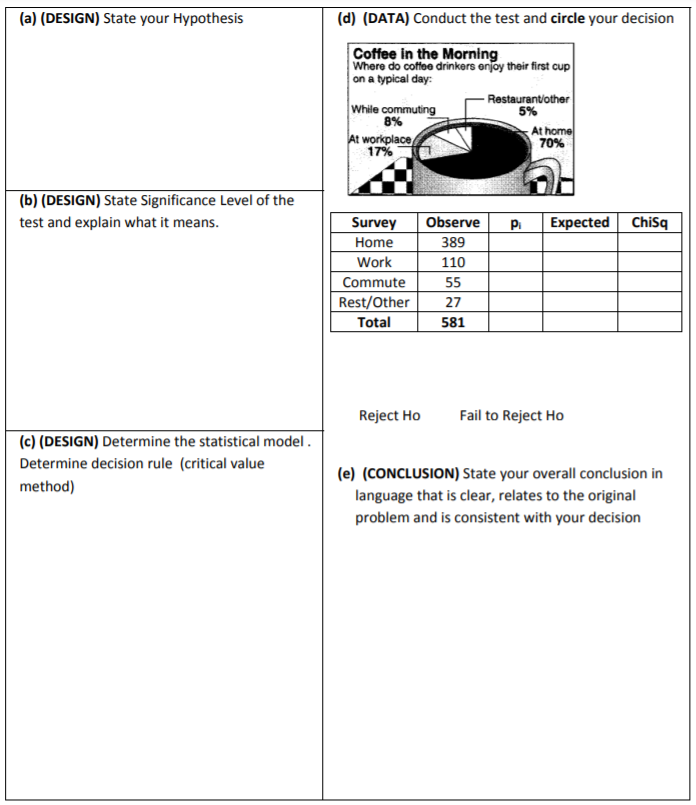
- Results from a five‐year‐old survey asked where coffee drinkers typically drink their first cup of coffee are shown in the graph. To determine whether this distribution has changed, you randomly select 581 coffee drinkers and asked them where they typically drink their first cup of coffee. The results are shown in the table. Can you conclude that there has been a change in the claimed or expected distribution? Use \(\alpha = 0.05\).
- In a SurveyUSA poll, 500 Americans adults were asked if marijuana should be legalized. The results of the poll were cross tabulated as shown in the contingency tables below. Conduct a hypothesis test for independence to determine if opinion about legalization of marijuana is dependent on age.
| Male | Female | |
| Should be Legal | 123 | 90 |
| Should Not be Legal | 127 | 160 |
- In a SurveyUSA poll, 500 Americans adults were asked if marijuana should be legalized. The results of the poll were cross tabulated as shown in the contingency tables below. Conduct a hypothesis test for independence to determine if opinion about legalization of marijuana is dependent on gender.
| 18‐34 | 35‐54 | 55+ | |
| Should be Legal | 95 | 83 | 48 |
| Should Not be Legal | 65 | 126 | 83 |
- 1000 American adults were recently polled on their opinion about effect of recent stimulus bill and the economy. The results are shown in the following contingency table, broken down by gender:
| Stimulus will hurt economy | Stimulus will help the economy | Stimulus will have no effect | TOTAL | |
| Male | 150 | 150 | 200 | 500 |
| Female | 100 | 200 | 200 | 500 |
| TOTAL | 250 | 350 | 400 | 1000 |
Are gender and opinion on the stimulus dependent variables? Test using \(\alpha =1\%\).
For the studies in questions 6 to 8, answer the following questions. (You will not have to actually conduct tests).
- State the Null and Alternative Hypotheses in words
- State the Null and Alternative Hypotheses in population parameters
- Choose the appropriate model from among these three:
- One population test of proportion
- Chi‐square goodness of fit
- Chi‐square test of independence
- Starting in 2018, the California State University System (CSU) changed their prerequisite requirements for a Statistics course needed for community college students to transfer. The original provision was that students needed to take Intermediate Algebra before Statistics. The new requirement is that students can take Intermediate Algebra or an alternative path to Statistics course as a prerequisite for Statistics. There is some concern that students who choose the alternative path may be less successful after transferring to CSU. A study is proposed to determine the graduation rates in 3 years for transfer students who passed Intermediate Algebra and those who passed the alternative course. Data will be collected and cross‐tabulated into two questions: "What path did the student choose?" and "Did the student graduate within 3 years of transfer?"
- The Achilles tendon connects the calf muscle to the heel bone. Of the patients who rupture (tear) the Achilles tendon and have it surgically repaired, 11% will re‐rupture the Achilles tendon within three years of treatment. A proposed non‐surgical method of treatment would treat the rupture with a series of casts, ultrasound and passive motion. The researcher wanted to show that the percentage of patients who choose the non‐surgical method of treatment had a reduced percentage of re‐ruptures.
- A sport's shoe company has designed a women's running shoe and is considering producing the shoe in 4 different colors: pink, blue, teal and gray. The company wants to know if there is a preference among women for a specific color of the shoe. 154 women who are runners will participate in the study.