
12.2: Chi‐square Test of Independence
- Page ID
- 20919

In 2014, Colorado became the first state to legalize the recreational use of marijuana. Other states have joined Colorado, while some have decriminalized or authorized the medical use of marijuana. The question is should marijuana be legalized in all states. Suppose we took a poll of 1000 American adults and asked "Should marijuana be legal or not legal for recreational use" and got the following results:
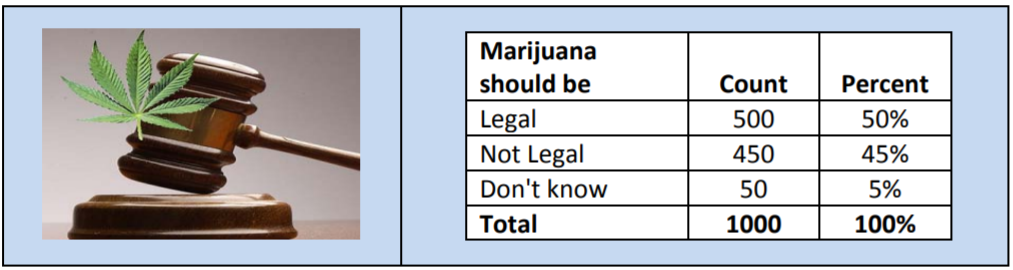
The interpretation of this poll is that 50% of adults polled favored the legalization of marijuana for recreational use, while 45% opposed it. The remaining 5% were undecided.
At this time, you might have questions and want to explore this poll in more depth. For example, are younger people more likely to support legalization of marijuana? Do other demographic characteristics such as gender, ethnicity, sexual orientation, or religion affect people's opinions about legalization?
Let us explore the possibility of difference of opinion due to gender. Are men more likely (or less likely) to oppose legalization of marijuana compared to women?
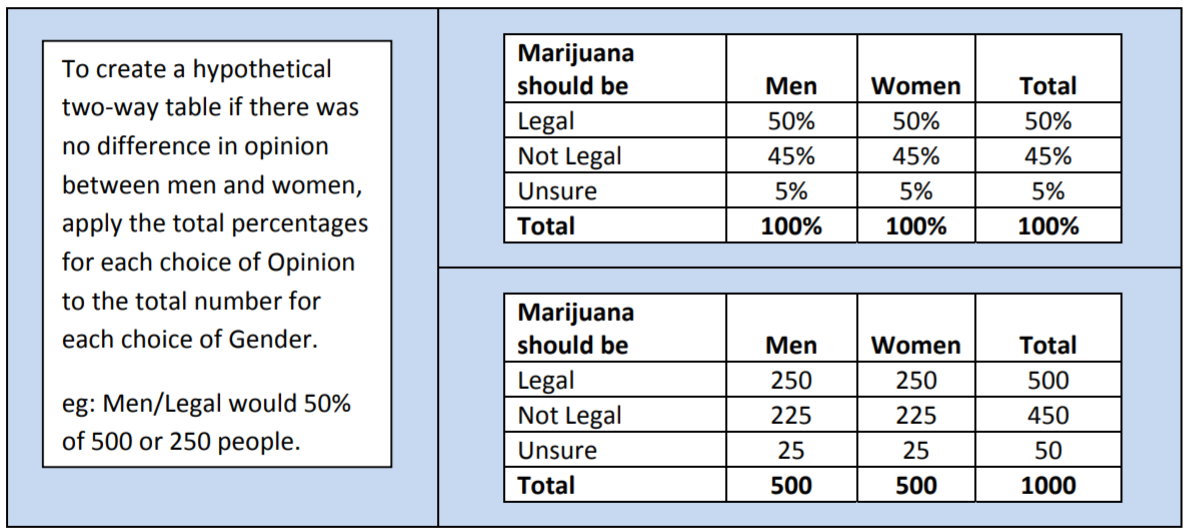
In the example above, suppose we have exactly 500 men and 500 women in the survey. What would we expect to see in the data if there were no difference in opinion between men and women?
Two‐way tables
Two‐way or contingency tables are used to summarize two categorical variables, also known as bivariate categorical data. In order to create a two‐way table, the researcher must cross‐tabulate the two responses for each categorical questions.
In the example above, the two categorical variables are gender and opinion on marijuana legalization. Gender has two choices (male or female) while opinion on marijuana legalization has three choices (legal, not legal and unsure).
In the example above, suppose we have exactly 500 men and 500 women in the survey. What would we expect to see in the data if there were no difference in opinion between men and women? We could then simply apply the total percentages to each group.
Let’s review from probability what independence means. If two events A an B are independent, then the following statements are true:
\[\begin{aligned}
P(\text {A given B})&=P(A) \\
P(\text {B given A})&=P(B) \\
P(\text {A and B})&=P(A) P(B)
\end{aligned} \nonumber \]
You can pick any two events in the table above to verify that Gender and Opinion of Legalization of Marijuana are independent events. For example, compare the events Not Legal and Men.
\(P\)(Not Legal given Men) = 225/500 = 45% same as \(P\)(Not Legal) = 45%
\(P\)(Men given Not Legal) = 225/450 = 50% same as \(P\)(Men) = 50%
\(P\)(Not Legal and Men) = 225/1000 = 22.5% same as \(P\)(Not Legal)P(Men) = (45%)(50%) = 22.5%
Based on these probability rules we can calculate the expected value of any pair of independent events by using the following formula:
Expected Value = (Row Total)(Column Total)/(Grand Total)
For example, looking at the events Not Legal and Men:
Expected Value = (450)(500)/(1000) = 225
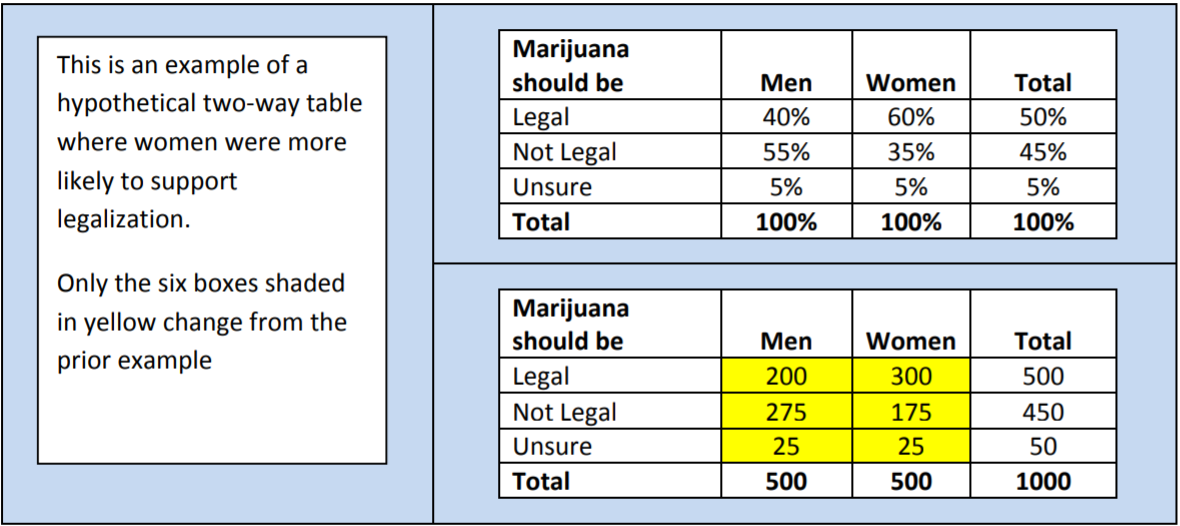
What if the events are not independent? Let's review the same survey. What would we expect to see in the data if there was a difference in opinion between men and women? Let's say women were more likely to support legalization. In that case, we would expect the 450 people who supported legalization of marijuana to have a higher number of women (and a smaller number of men) compared to the first table. Note we only change the first six boxes (shaded below); the totals must remain the same.
Now let's see the actual results of this survey and see what is happening:
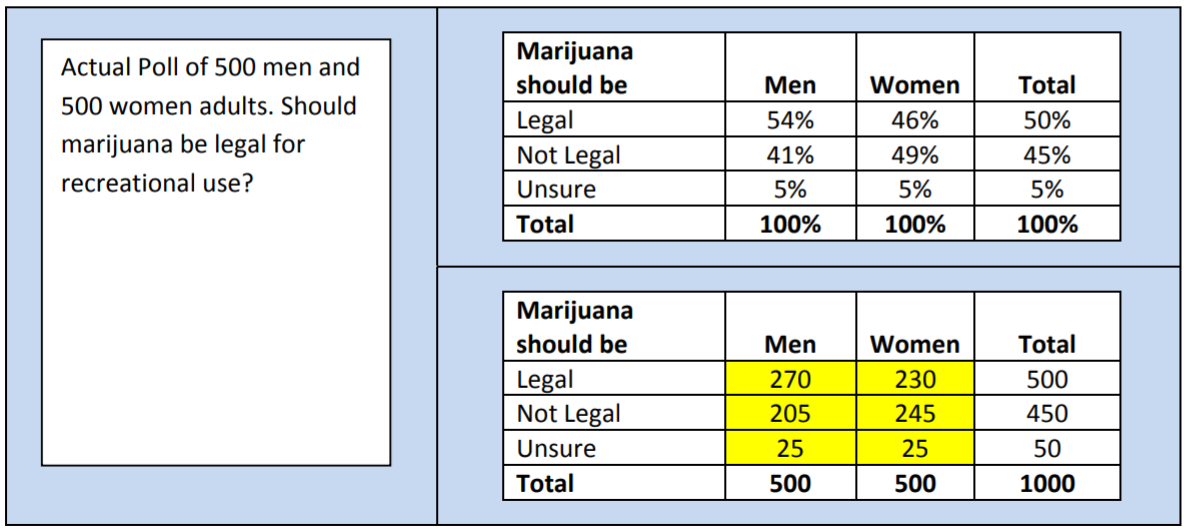
In this poll, a higher percentage of men support legalization of marijuana for recreational use compared to women. Question: Is this evidence strong enough to support the claim that gender and opinion about marijuana legalization are not independent events? This question can addressed by conducting a hypothesis test using with the Chi‐square Test for Independence model.
Chi‐square test of Independence
A Chi‐square test of independence can be used to determine if there is a relationship between two randomized categorical variables. If the categorical variables are labeled A and B, the hypotheses are always written in this form:
\(H_o\): A and B are independent events
\(H_a\): A and B are dependent events.
If only one variable is randomized, then the test is called a Chi‐square Test of Homogeneity, but the execution of the test is exactly the same. If A represents the randomized response variable and B represents the manipulated explanatory variable, then the hypotheses are written as:
\(H_o\): There no difference in distribution of A due to B.
\(H_a\): There is a difference in the distribution of A due to B.
Model Assumptions
- \(O_{i j}\) = Observed in category \(ij\)
- \(E_{i j}=n p_{i j}=\dfrac{(\text { ColumnTotal })(\text { RowTotal })}{\text { Grand Total }}\); \(E_{i j} \geq 5 \text { for each ij }\)
Test Statistic
- \(\chi^{2}=\sum_{i=1}^{r} \sum_{j=1}^{c} \dfrac{\left(O_{i j}-E_{i j}\right)^{2}}{E_{i j}} \quad \mathrm{df}=(r-1)(c-1)\) where
r = number of row categories c = number of column categories n = sample size
Example: Legalization of marijuana
Are Gender and Opinion about legalization of marijuana for recreational use independent events? Conduct a hypothesis test with a significance level of 5%.
Solution
Research Hypotheses:
\(H_o\): Gender and Opinion about legalization of marijuana for recreational use are independent events.
\(H_a\): Gender and Opinion about legalization of marijuana for recreational use are dependent events.
Statistical Model: Chi‐square Test of Independence. The two categorical variables in this example are Gender and Opinion.
Results:
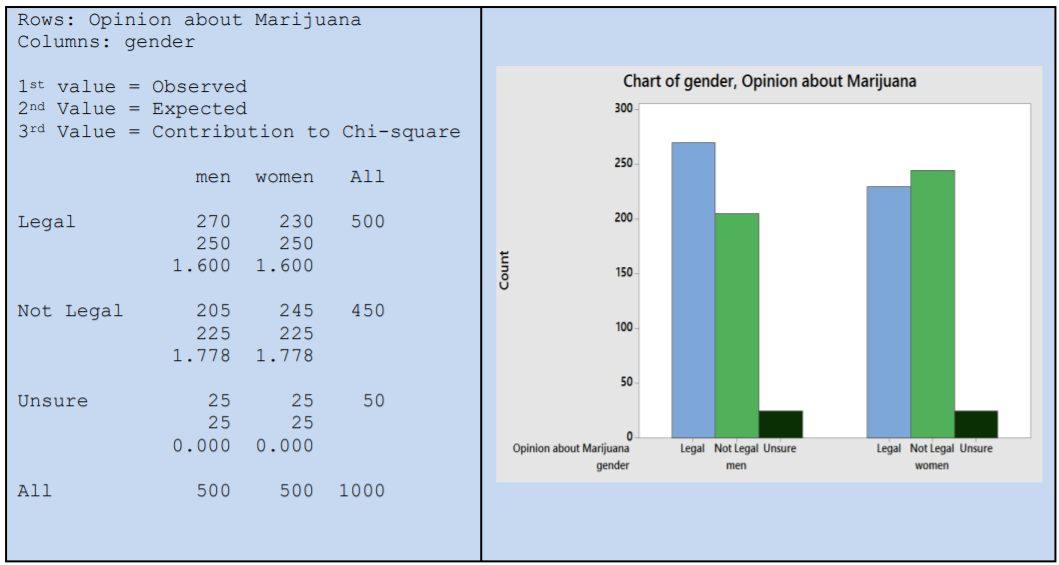
Important Assumption: The Expected Value of Each Category needs to be greater than or equal to 5. In this example, the lowest expected value is 225 (Men, not legal) so the assumption is met.
Test Statistic: \(\chi^{2}=\sum_{i=1}^{r} \sum_{j=1}^{c} \dfrac{\left(O_{i j}-E_{i j}\right)^{2}}{E_{i j}} \qquad \mathrm{df}=(3-1)(2-1)=2\)
Decision Rule (Critical Value Method): Reject \(H_o\) if \(\chi^{2}>5.991(\alpha=.05,2 \mathrm{df})\)
\(\chi^{2}=1.600+1.600+1.778+1.778=6.756\)
Since the Test Statistic exceeds the critical value, the decision is to Reject \(H_o\). Under the \(p\)‐value method, \(H_o\) is also rejected since the \(p \text {-value }=p\left(\chi^{2}>6.756\right)=0.034\), which is less than the Significance Level \(\alpha\) of 5%.
Conclusion:
Gender and Opinion about legalization of marijuana for recreational use are dependent events. Men are more likely to support legalization of marijuana for recreational use.