Statistics LibreTexts

9.1: Inferential Statistics

  • Page ID
    20901
  • \( \newcommand{\vecs}[1]{\overset { \scriptstyle \rightharpoonup} {\mathbf{#1}} } \) \( \newcommand{\vecd}[1]{\overset{-\!-\!\rightharpoonup}{\vphantom{a}\smash {#1}}} \)\(\newcommand{\id}{\mathrm{id}}\) \( \newcommand{\Span}{\mathrm{span}}\) \( \newcommand{\kernel}{\mathrm{null}\,}\) \( \newcommand{\range}{\mathrm{range}\,}\) \( \newcommand{\RealPart}{\mathrm{Re}}\) \( \newcommand{\ImaginaryPart}{\mathrm{Im}}\) \( \newcommand{\Argument}{\mathrm{Arg}}\) \( \newcommand{\norm}[1]{\| #1 \|}\) \( \newcommand{\inner}[2]{\langle #1, #2 \rangle}\) \( \newcommand{\Span}{\mathrm{span}}\) \(\newcommand{\id}{\mathrm{id}}\) \( \newcommand{\Span}{\mathrm{span}}\) \( \newcommand{\kernel}{\mathrm{null}\,}\) \( \newcommand{\range}{\mathrm{range}\,}\) \( \newcommand{\RealPart}{\mathrm{Re}}\) \( \newcommand{\ImaginaryPart}{\mathrm{Im}}\) \( \newcommand{\Argument}{\mathrm{Arg}}\) \( \newcommand{\norm}[1]{\| #1 \|}\) \( \newcommand{\inner}[2]{\langle #1, #2 \rangle}\) \( \newcommand{\Span}{\mathrm{span}}\)\(\newcommand{\AA}{\unicode[.8,0]{x212B}}\)

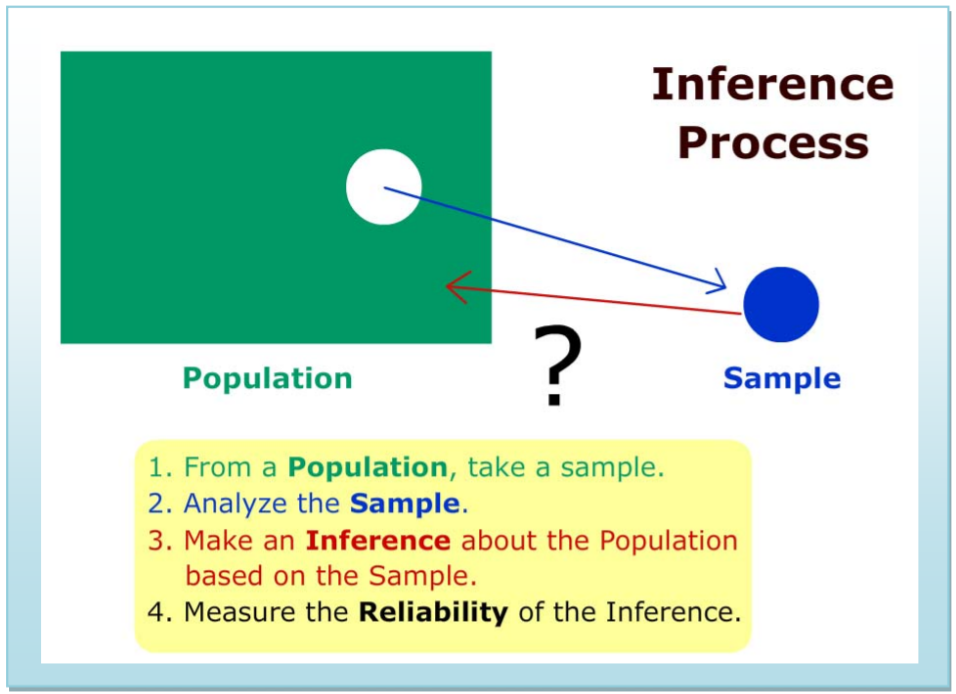
    The reason we conduct statistical research is to obtain an understanding about phenomena in a population. For example, we may want to know if a potential drug is effective in treating a disease. Since it is not feasible or ethical to distribute an experimental drug to the entire population, we instead must study a small subset of the population called a sample. We then analyze the sample and make an inference about the population based on the sample. Using probability theory and the Central Limit Theorem, we can then measure the reliability of the inference. 

    clipboard_e559aba6acab0a9a4e8938f731342c399.png

    Example: Home value appraisal

    Lupe is trying to sell her house and needs to determine the market value of the home. The population in this example would be all the homes that are similar to hers in the neighborhood.

    clipboard_e0bea33467b2af81dac45174ad7906118.png

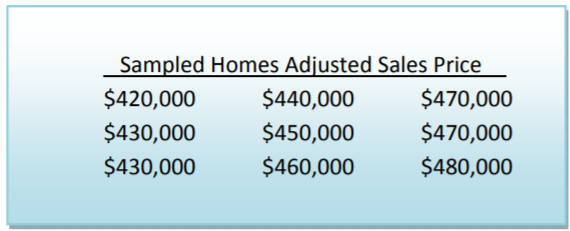
    Lupe’s realtor chooses for the sample nine recent homes in this neighborhood that sold in the last six months. The realtor then adjusts some of the sales prices to account for differences among Lupe’s home and the sold homes.

    Next the realtor takes the mean of the adjusted sample and recommends to Lupe a market value for Lupe’s home of $450,000. The realtor has made an inference about the mean value of the population.

    To measure the reliability of the inference, the realtor should look at factors such as: the small sample size, changes in values of homes over the last six months, or the fact that Lupe’s home is not exactly like the sampled homes.  


    This page titled 9.1: Inferential Statistics is shared under a CC BY-SA 4.0 license and was authored, remixed, and/or curated by Maurice A. Geraghty via source content that was edited to the style and standards of the LibreTexts platform; a detailed edit history is available upon request.