
4.5: Bias in Statistical Studies
- Page ID
- 20852

In the last selection we discussed how non‐probability sampling methods will often not create a representative sample that is needed to draw any meaningful conclusions. These methods usually create two types of bias.
Selection Bias
Selection bias occurs when the sampling method does not create a representative sample for the study. Selection bias frequently occurs when using convenience sampling.
Example: Library fee

A community college proposes increasing the student fee by $5.00 in order to create more open hours for the library. A survey was conducted by several student researchers to see if there was support for this fee. The researchers stood in the central part of the campus near the library and selected students for their sample as they were walking by. The students were only sampled during the morning hours.
This is a convenience sample and probably not representative for this study. The students sampled only day students, excluding night students who are less likely to use the library. Some excluded students only take classes online and don't use the library. Finally, the survey was conducted near the library, so it is more likely that the sample contained library users, who would probably be more likely to support added services. This is a clear example of selection bias.
Self‐selection Bias
Self‐selection bias occurs when individuals can volunteer to be part of the study, the non‐probability self‐selected sampling method discussed above. Volunteers will often have a stronger opinion about the research question and will usually not be representative of the population.
Example: Twitter poll
Many members of congress will try to use online surveys to generate support for their position. Here is an example during the 2017 attempt to repeal the Affordable Care Act (ObamaCare).
Rep. Marsha Blackburn (R‐Tenn.) on Tuesday posted a poll on Twitter to get feedback on Republicans' proposed ObamaCare repeal. As it turns out, though, a majority of Twitter users who voted recommended keeping the healthcare law in place.
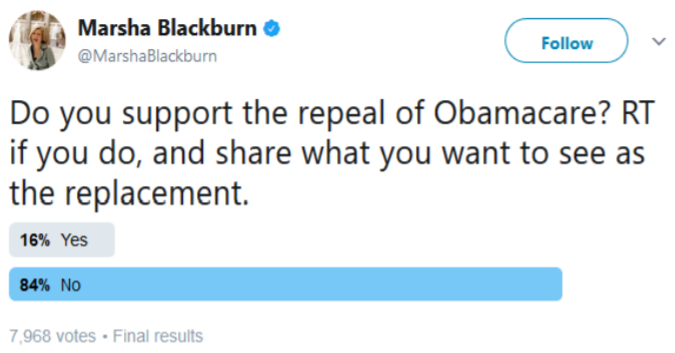
While Blackburn might have expected to hear only from her Tennessee district — which handily reelected her in November — she soon found the poll swamped with votes opposed to an ObamaCare repeal.
The poll from Blackburn, a member of President‐elect Trump's transition team, received 7,968 votes, with 84 percent opposing a repeal of ObamaCare. The repeal opponents' side was likely helped by a retweet from White House spokesman Eric Schultz.59
84% of the respondents did not support the repeal of ObamaCare, a much higher percentage than is shown in properly conducted surveys. Supporters of the Affordable Care Act could encourage others to vote in the poll. Plus a Twitter poll is never going to be representative since the sampled population is only Twitter users. The wording of the question is also biased, a phenomena that will be explored later in this section.
Bias also occurs when a poll or survey produces results that do not reflect the true opinions or beliefs of the general population. This is often a result of the methods used to conduct the survey or the wording of the questions asked.60
Non‐response Bias
Non‐response bias occurs when people are intentionally or non‐intentionally excluded from participation or choose not to participate in a survey or poll. Sometimes people will lie to pollsters as well.
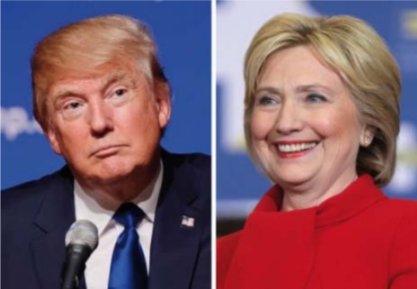
A recent example of probable non‐response bias occurred during the 2016 presidential election where, in which every poll showed Hillary Clinton winning the election over Donald Trump. Although Clinton won the popular vote, Trump won the electoral vote and the presidency.61
The Pew Center Research conducted a post‐mortem of the election polling and pointed to probable non‐ response bias:
One likely culprit is what pollsters refer to as non‐response bias. This occurs when certain kinds of people systematically do not respond to surveys despite equal opportunity outreach to all parts of the electorate. We know that some groups – including the less educated voters who were a key demographic for Trump on Election Day – are consistently hard for pollsters to reach. It is possible that the frustration and anti‐ institutional feelings that drove the Trump campaign may also have aligned with an unwillingness to respond to polls. The result would be a strongly pro‐Trump segment of the population that simply did not show up in the polls in proportion to their actual share of the population.
Some have also suggested that many of those who were polled simply were not honest about whom they intended to vote for. The idea of so‐called “shy Trumpers” suggests that support for Trump was socially undesirable, and that his supporters were unwilling to admit their support to pollsters. This hypothesis is reminiscent of the supposed “Bradley effect,” when Democrat Tom Bradley, the black mayor of Los Angeles, lost the 1982 California gubernatorial election to Republican George Deukmejian despite having been ahead in the polls, supposedly because voters were reluctant to tell interviewers that they were not going to vote for a black candidate.
A third possibility involves the way pollsters identify likely voters. Because we can’t know in advance who is actually going to vote, pollsters develop models predicting who is going to vote and what the electorate will look like on Election Day. This is a notoriously difficult task, and small differences in assumptions can produce sizable differences in election predictions. We may find that the voters that pollsters were expecting, particularly in the Midwestern and Rust Belt states that so defied expectations, were not the ones that showed up. Because many traditional likely‐voter models incorporate measures of enthusiasm into their calculus, 2016’s distinctly unenthused electorate – at least on the Democratic side – may have also wreaked some havoc with this aspect of measurement.62
Pew’s analysis showed three possible sources of non‐response bias. First, it may have been more difficult to reach Trump supporters. Second, Trump supporters, may be less honest to pollsters. Finally, the pollsters may have incorrectly identified likely voters, meaning Trump voters were undersampled.
Response Bias
Response bias occurs when the responses to a survey are influenced by the way the question is asked, or when responses do not reflect the true opinion of the respondent. When conducting a survey or poll, the type, order and wording of questions are important considerations. Poorly worded questions can invalidate the results of a survey.
Questions should be asked in a manner that is balanced.
Example: High speed rail

Consider the questions:
“Do you feel that the increasing cost of the high speed rail project is too expensive for California?”
“Do you feel that high speed rail will be important to the future economy of California?”
“Do you approve or disapprove of building a high speed rail system in California?”
The first question encourages people to oppose high speed rail because of the expense. The second question encourages people to support high speed rail to support the economy. The third question simply asks people’s opinion without the leading bias.
Example: Twitter poll
Let’s return to the Twitter poll example in which Marsha Blackburn, an opponent of the Affordable Care Act, asked followers to vote on the question: “Do you support the repeal of Obamacare? [Retweet] if you do, and share what you want to see as the replacement.”
There are many sources of bias in this question. First, supporting a repeal sounds like supporting, the more positive stance. Secondly, many polls have shown that using the words “Obamacare” instead of “Affordable Care Act” will encourage support for repeal. Finally, the last part of the question is encouraging people to take action if they support repeal.
Questions should not be vague.
For example, the question “What’s wrong with the economy?” is vague. It is unclear what the question is trying to determine.
Here are some questions from recent polls and surveys regarding same sex marriage. Discuss the issues of bias and fairness in these questions:
Should states continue to discriminate against couples who want to marry and who are of the same gender?
Do you support marriage equality?
Should states be forced to legalize homosexual marriage over the wishes of a majority of the people?
Do you think marriages between same‐sex couples should or should not be recognized by the law as valid, with the same rights as traditional marriages?
Giving people explanatory information can change their opinions
Care must be taken in providing explanatory information about an issue; however, providing no information may also lead to misleading results. For example, you might want to ask people if they support the CHIP program. Most people have no idea what the CHIP program is, so some explanation is needed. You then add the language: “The Children's Health Insurance Program (CHIP) is a program administered by the federal government whose aim is to help states provide health insurance to families with children who were just above the financial threshold for Medicaid.”
Example: Aid to Puerto Rico after Hurricane Maria
On September 20, 2017, Hurricane Maria caused catastrophic damage to the U.S. territory of Puerto Rico. This came shortly after two other major hurricanes hit the United States, causing major damage in Texas and Florida.
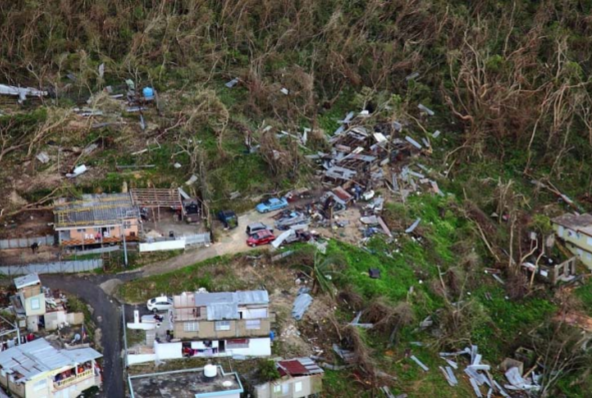
However, the initial public support for Puerto Rico seemed less than that for Florida or Texas. A poll of 2200 American adults conducted by Morning Consult showed that only 54% of Americans knew that Puerto Rico was part of the United States.63
The survey then split the sample into two groups to answer the question “Should Puerto Rico receive additional government aid to help rebuild the territory?” The first group was given no information about Puerto Rican citizenship and 64% supported giving aid. The second group was first told that Puerto Ricans were American citizens, and support for aid increased to 68%.
In conclusion, the wording of polls or providing additional information can lead to biased results and care should be taken so the wording of the questions is both clear and balanced.