Statistics LibreTexts

7: Multidimensional Data - Analysis of Structure

  • Page ID
    3588
  • \( \newcommand{\vecs}[1]{\overset { \scriptstyle \rightharpoonup} {\mathbf{#1}} } \) \( \newcommand{\vecd}[1]{\overset{-\!-\!\rightharpoonup}{\vphantom{a}\smash {#1}}} \)\(\newcommand{\id}{\mathrm{id}}\) \( \newcommand{\Span}{\mathrm{span}}\) \( \newcommand{\kernel}{\mathrm{null}\,}\) \( \newcommand{\range}{\mathrm{range}\,}\) \( \newcommand{\RealPart}{\mathrm{Re}}\) \( \newcommand{\ImaginaryPart}{\mathrm{Im}}\) \( \newcommand{\Argument}{\mathrm{Arg}}\) \( \newcommand{\norm}[1]{\| #1 \|}\) \( \newcommand{\inner}[2]{\langle #1, #2 \rangle}\) \( \newcommand{\Span}{\mathrm{span}}\) \(\newcommand{\id}{\mathrm{id}}\) \( \newcommand{\Span}{\mathrm{span}}\) \( \newcommand{\kernel}{\mathrm{null}\,}\) \( \newcommand{\range}{\mathrm{range}\,}\) \( \newcommand{\RealPart}{\mathrm{Re}}\) \( \newcommand{\ImaginaryPart}{\mathrm{Im}}\) \( \newcommand{\Argument}{\mathrm{Arg}}\) \( \newcommand{\norm}[1]{\| #1 \|}\) \( \newcommand{\inner}[2]{\langle #1, #2 \rangle}\) \( \newcommand{\Span}{\mathrm{span}}\)\(\newcommand{\AA}{\unicode[.8,0]{x212B}}\)

    “Data Mining”, “Big Data”, “Machine Learning”, “Pattern Recognition” phrases often mean all statistical methods, analytical and visual which help to understand the structure of data. Data might be of any kind, but it is usually multidimensional, which is best represented with the table of multiple columns a.k.a. variables (which might be of different types: measurement, ranked or categorical) and rows a.k.a objects. So more traditional name for these methods is “multivariate data analysis” or “multivariate statistics”.

    Data mining is often based on the idea of classification, arrange objects into non-intersecting, frequently hierarchical groups. We use classification all the time (but sometimes do not realize it). We open the door and enter the room, the first thing is to recognize (classify) what is inside. Our brain has the outstanding power of classification, but computers and software are speedily advancing and becoming more brain-like. This is why data mining is related with artificial intelligence. There are even methods calling “neural networks”!
    imageedit_3_3430149931.png
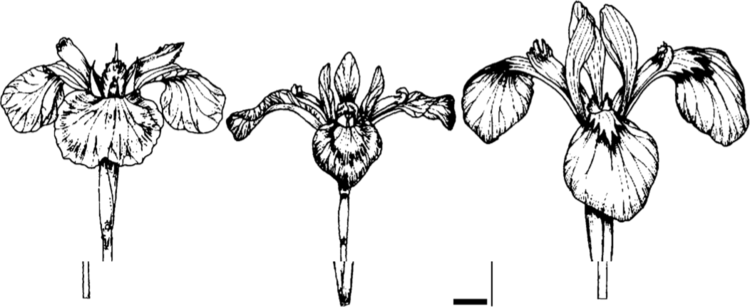
    Figure \(\PageIndex{1}\) Flowers of irises from the iris data (from left to right): Iris setosa Pall.,I. versicolor L. and I. virginica. L. Scale bar is approximately 10 mm.

    In this chapter, along with the other data, we will frequently use the embedded iris data taken from works of Ronald Fisher\(^{[1]}\). There are four characters measured on three species of irises (Figure \(\PageIndex{1}\)), and fifth column is the species name.

    References

    1. Fisher R.A. 1936. The use of multiple measurements in taxonomic problems. Annals of Eugenics. 7(2): 179–188.


    This page titled 7: Multidimensional Data - Analysis of Structure is shared under a Public Domain license and was authored, remixed, and/or curated by Alexey Shipunov via source content that was edited to the style and standards of the LibreTexts platform; a detailed edit history is available upon request.