
4.2: Pooled Two-sampled t-test (Assuming Equal Variances)
- Page ID
- 2891

Pooled Two-sampled t-test (Assuming Equal Variances)
In the previous section, we made the assumption of unequal variances between our two populations. Welch’s t-test statistic does not assume that the population variances are equal and can be used whether the population variances are equal or not. The test that assumes equal population variances is referred to as the pooled t-test. Pooling refers to finding a weighted average of the two independent sample variances.
The pooled test statistic uses a weighted average of the two sample variances.
\[S_p^2 = \frac {(n_1-1)S_1^2+(n_2-1)S_2^2}{n_1+n_2-2} = (\frac {n_1-1}{n_1+n_2-2})S_1^2 + (\frac {n_2-1}{n_1+n_2-2})S_2^2\]
If \(n_1= n_2\), then \(S^2_p = (\frac {1}{2}s^2_1 + (1/2)s^2_2\), the average of the two sample variances. But whenever n1≠n2, the \(s^2\) based on the larger sample size will receive more weight than the other \(s^2\).
The advantage of this test statistic is that it exactly follows the student’s t-distribution with n1+ n2– 2 degrees of freedom.
\[t=\frac {\bar {X_1} - \bar {X_2}}{\sqrt {S_p^2(\frac {1}{n_1}+\frac {1}{n_2})}}=\frac {\bar {X_1}- \bar {X_2}}{S_p\sqrt {\frac {1}{n_1} +\frac {1}{n_2}}}\]
The hypothesis test procedure will follow the same steps as the previous section.
It may be difficult to verify that two population variances might be equal based on sample data. The F-test is commonly used to test variances but is not robust. Small departures from normality greatly impact the outcome making the results of the F-test unreliable. It can be difficult to decide if a significant outcome from an F-test is due to the differences in variances or non-normality. Because of this, many researchers rely on Welch’s t when comparing two means.
Growth of pine seedlings in two different substrates was measured. We want to know if growth was better in substrate 2. Growth (in cm/yr) was measured and included in the table below. α = 0.05
|
Substrate 1 |
Substrate 2 |
|---|---|
|
3.2 |
4.5 |
|
4.5 |
6.2 |
|
3.8 |
5.8 |
|
4.0 |
6.0 |
|
3.7 |
7.1 |
|
3.2 |
6.8 |
|
4.1 |
7.2 |
Solution
\(H_0: \mu_1 = \mu_2\)
\(H_1: \mu_1 < \mu_2\)
\[S^2_p=\frac {(7-1)0.474^2 +(7-1)0.936^2}{7+7-2} = 0.55\]
\[t=\frac {3.79-6.23}{\sqrt{0.55(\frac {1}{7}+ \frac {1}{7})}}=\frac {-2.44}{0.396}=-6.16\]
This is a one-sided test with \(n_1 + n_2 – 2 = 12\) degrees of freedom. The critical value is -1.782. The test statistic is less than the critical value so we will reject the null hypothesis.
There is enough evidence to support the claim that the mean growth is less in substrate 1. Growth in substrate 2 is greater.
The confidence interval approach also uses the pooled variance and takes the form:
\[(\bar {x_1}-\bar {x_2}) \pm t_{\frac {\alpha}{2}}\sqrt {s^2_p(\frac {1}{n_1}+\frac {1}{n_2})}\]
using \(n_1 + n_2 – 2\) degrees of freedom. So let’s answer the same question with a 90% confidence interval.
\[(3.79-6.23)\pm 1.782 \sqrt{0.55(\frac {1}{7}+\frac {1}{7})} = (-2.44 \pm 0.7064)=(-3.146,-1.734)\]
All negative values tell you that there is a significant difference between the mean growth for the two substrates and that the growth in substrate 1 is significantly lower than the growth in substrate 2 with reduction in growth ranging from 1.734 to 3.146 cm/yr.
Software Solutions
Minitab


Two-Sample T-Test and CI: Substrate1, Substrate2
|
Two-sample T for Substrate1 vs. Substrate2 |
||||
|---|---|---|---|---|
|
N |
Mean |
StDev |
SE Mean |
|
|
Substrate1 |
7 |
3.786 |
0.474 |
0.18 |
|
Substrate2 |
7 |
6.229 |
0.936 |
0.35 |
|
Difference = mu (Substrate1) – mu (Substrate2) |
||||
|
Estimate for difference: -2.443 |
||||
|
95% upper bound for difference: -1.736 |
||||
|
T-Test of difference = 0 (vs <): T-Value = -6.16 p-value = 0.000 DF = 12 |
||||
|
Both use Pooled StDev = 0.7418 |
||||
The p-value (0.000) is less than the level of significance (0.05). We will reject the null hypothesis.
Excel
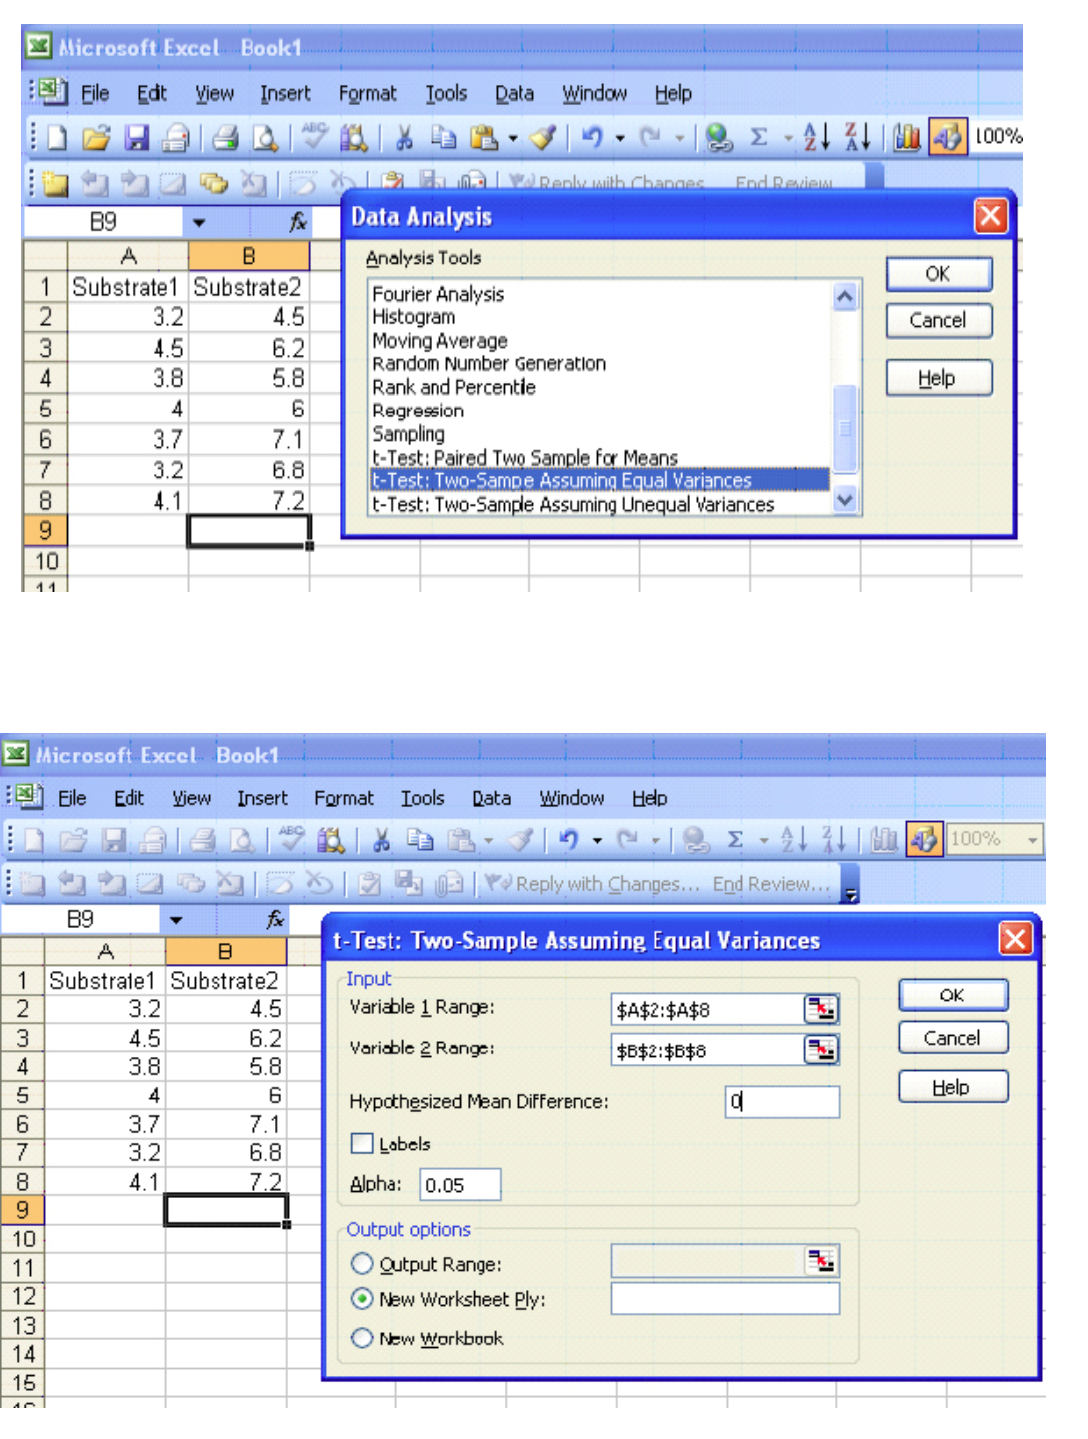
|
t-Test: Two-Sample Assuming Equal Variances |
||
|
Variable 1 |
Variable 2 |
|
|
Mean |
3.785714 |
6.228571 |
|
Variance |
0.224762 |
0.875714 |
|
Observations |
7 |
7 |
|
Pooled Variance |
0.550238 |
|
|
Hypothesized Mean Difference |
0 |
|
|
df |
12 |
|
|
t Stat |
-6.16108 |
|
|
P\((T \le t)\) one-tail |
2.43E-05 |
|
|
t Critical one-tail |
1.782288 |
|
|
P\((T \le t)\) two-tail |
4.86E-05 |
|
|
t Critical two-tail |
2.178813 |
|
This is a one-sided test (greater than) so use the P\((T \le t)\) one-tail value 2.43E-05. The p-value (0.0000243) is less than the level of significance (0.05). We will reject the null hypothesis.